Technical Analysis of WSFS 2024-05-10
Overview:
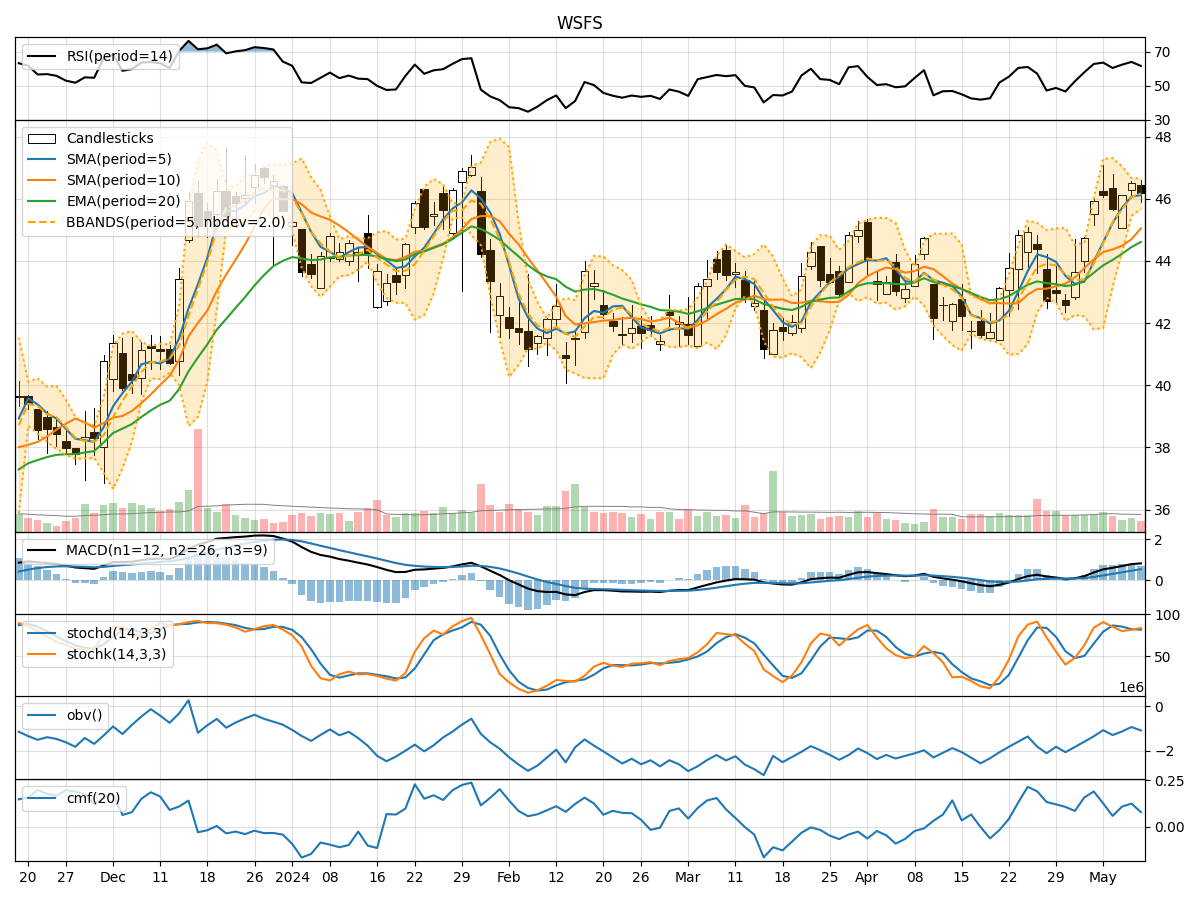
In analyzing the technical indicators for WSFS stock over the last 5 days, we will delve into the trend, momentum, volatility, and volume indicators to provide a comprehensive outlook on the possible future stock price movement. By examining these key indicators, we aim to offer valuable insights and predictions for the upcoming trading days.
Trend Analysis:
- Moving Averages (MA): The 5-day Moving Average (MA) has been consistently above the Simple Moving Average (SMA) and Exponential Moving Average (EMA), indicating a bullish trend.
- MACD: The MACD line has been above the signal line for the past few days, suggesting positive momentum in the stock price.
- RSI: The Relative Strength Index (RSI) has been fluctuating around the overbought territory, indicating strong buying pressure.
Momentum Analysis:
- Stochastic Oscillator: Both %K and %D lines of the Stochastic Oscillator have been in the overbought zone, signaling a potential reversal or consolidation.
- Williams %R: The Williams %R indicator has been hovering in the oversold region, suggesting a possible bullish reversal.
Volatility Analysis:
- Bollinger Bands (BB): The stock price has been trading within the Bollinger Bands, with the bands narrowing, indicating decreasing volatility.
- BB% (Bollinger Band %B): The %B indicator has been relatively stable, showing a lack of extreme price movements.
Volume Analysis:
- On-Balance Volume (OBV): The OBV indicator has been fluctuating, reflecting mixed buying and selling pressure.
- Chaikin Money Flow (CMF): The CMF has been positive but not significantly strong, indicating moderate buying pressure.
Key Observations and Opinions:
- Trend: The stock is currently in an upward trend based on moving averages and MACD.
- Momentum: The momentum indicators suggest a potential reversal due to overbought conditions.
- Volatility: Volatility is decreasing, indicating a possible period of consolidation.
- Volume: The volume indicators show mixed signals with no clear direction.
Conclusion:
Based on the analysis of the technical indicators, the next few days for WSFS stock could see a potential consolidation phase with a slight bias towards a bullish reversal. Traders should closely monitor the Stochastic Oscillator for any signs of a reversal in momentum and keep an eye on the OBV for confirmation of buying pressure. It is advisable to set tight stop-loss levels to manage risk effectively in this uncertain market environment.