Technical Analysis of WTFC 2024-05-10
Overview:
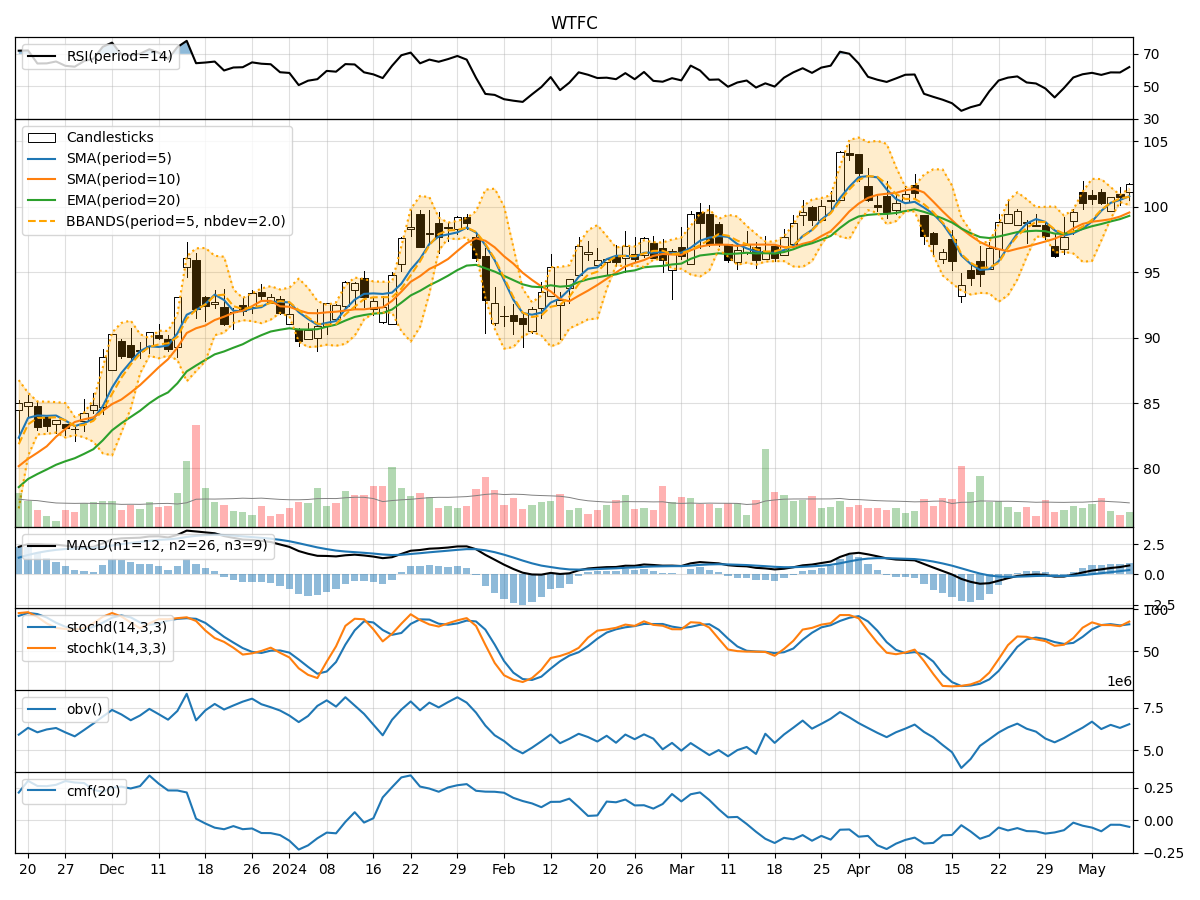
In analyzing the technical indicators for WTFC over the last 5 days, we will delve into the trend, momentum, volatility, and volume indicators to provide a comprehensive outlook on the possible stock price movement in the coming days.
Trend Indicators:
- Moving Averages (MA): The 5-day MA has been consistently rising, indicating a bullish trend in the short term.
- MACD: The MACD line has been increasing, crossing above the signal line, suggesting a bullish momentum.
- EMA: The exponential moving average has been trending upwards, supporting the bullish sentiment.
Momentum Indicators:
- RSI: The RSI has been in the neutral zone, indicating neither overbought nor oversold conditions.
- Stochastic Oscillator: Both %K and %D have been fluctuating but are currently in the overbought territory.
- Williams %R: The indicator is in the oversold region, suggesting a potential reversal.
Volatility Indicators:
- Bollinger Bands: The stock price has been trading within the bands, indicating a period of consolidation.
- Bollinger %B: The %B value has been fluctuating around 1, suggesting price is near the upper band.
Volume Indicators:
- On-Balance Volume (OBV): The OBV has been fluctuating, indicating mixed buying and selling pressure.
- Chaikin Money Flow (CMF): The CMF has been negative, suggesting outflow of money from the stock.
Key Observations:
- The trend indicators point towards a bullish sentiment in the short term.
- Momentum indicators show mixed signals with a slight bias towards overbought conditions.
- Volatility indicators suggest a period of consolidation.
- Volume indicators indicate a lack of strong buying or selling pressure.
Conclusion:
Based on the analysis of the technical indicators, the stock of WTFC is likely to experience sideways movement in the coming days with a slight bullish bias. Traders may consider staying cautious and monitoring key support and resistance levels for potential entry or exit points. It is advisable to wait for clearer signals from the indicators before taking significant trading decisions.