Technical Analysis of WVE 2024-05-10
Overview:
In analyzing the technical indicators for WVE over the last 5 days, we will delve into the trend, momentum, volatility, and volume indicators to provide a comprehensive outlook on the possible stock price movement in the coming days. By examining these key indicators, we aim to offer valuable insights and predictions for informed decision-making.
Trend Analysis:
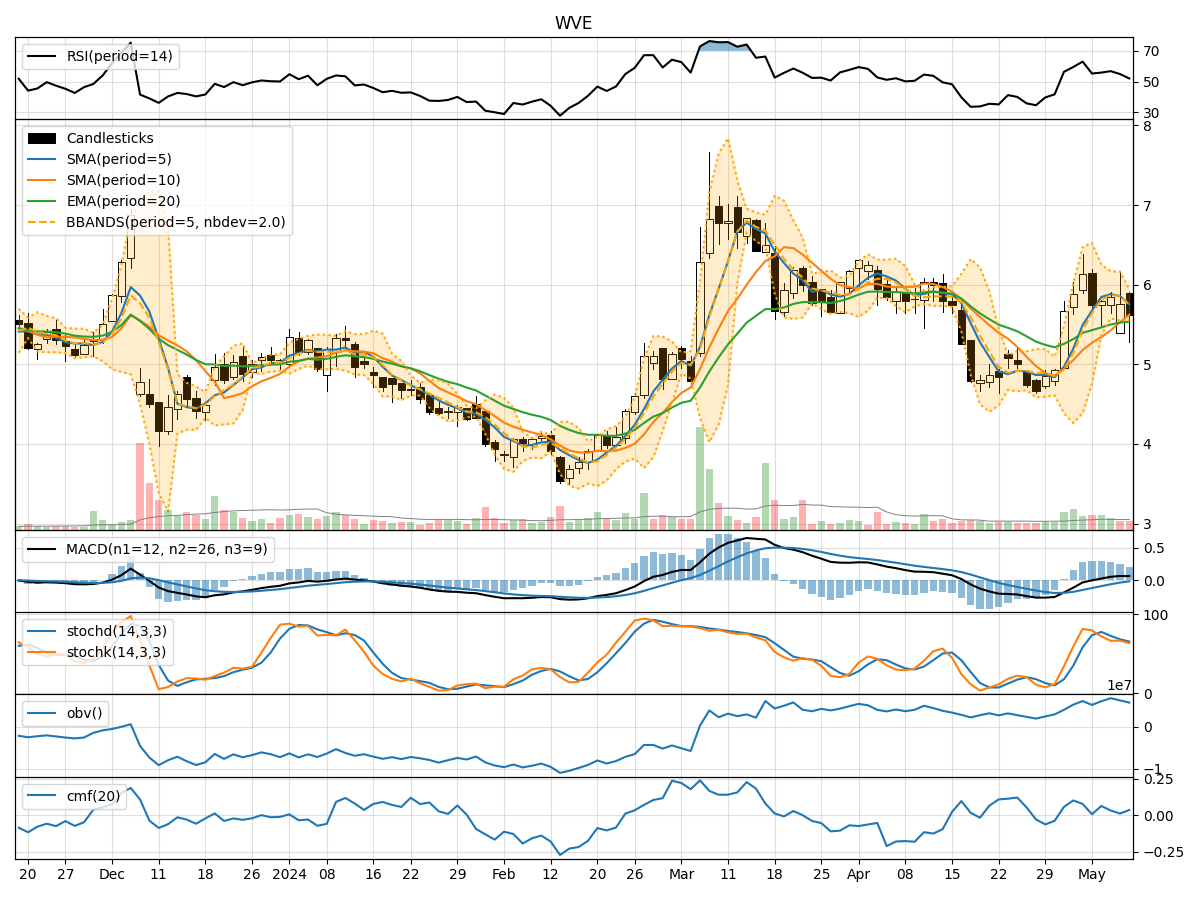
- Moving Averages (MA): The 5-day Moving Average (MA) has been fluctuating around the closing prices, indicating short-term price trends. The Simple Moving Average (SMA) and Exponential Moving Average (EMA) show an overall uptrend.
- MACD: The Moving Average Convergence Divergence (MACD) and its signal line (MACDH) have been positive, suggesting bullish momentum.
Momentum Analysis:
- RSI: The Relative Strength Index (RSI) has been fluctuating around the mid-level, indicating a balanced momentum.
- Stochastic Oscillator: Both %K and %D have been in the neutral zone, suggesting a lack of strong momentum.
- Williams %R: The Williams %R is in the oversold territory, indicating a potential reversal.
Volatility Analysis:
- Bollinger Bands (BB): The Bollinger Bands show narrowing volatility, with the price approaching the lower band, indicating a potential reversal or consolidation.
Volume Analysis:
- On-Balance Volume (OBV): The OBV has been relatively stable, indicating consistent buying pressure.
- Chaikin Money Flow (CMF): The CMF has been positive, suggesting money flow into the stock.
Key Observations:
- The trend indicators suggest a bullish sentiment with the moving averages and MACD signaling an uptrend.
- Momentum indicators show mixed signals with RSI neutral, Stochastic in a neutral zone, and Williams %R in oversold territory.
- Volatility is decreasing, indicating a potential consolidation phase.
- Volume indicators reflect consistent buying pressure with positive OBV and CMF.
Conclusion:
Based on the analysis of technical indicators, the stock price of WVE is likely to experience sideways movement or consolidation in the coming days. The bullish trend indicated by moving averages and MACD may face resistance due to mixed momentum signals and decreasing volatility. Traders should monitor key support and resistance levels for potential entry or exit points.