Technical Analysis of WWD 2024-05-10
Overview:
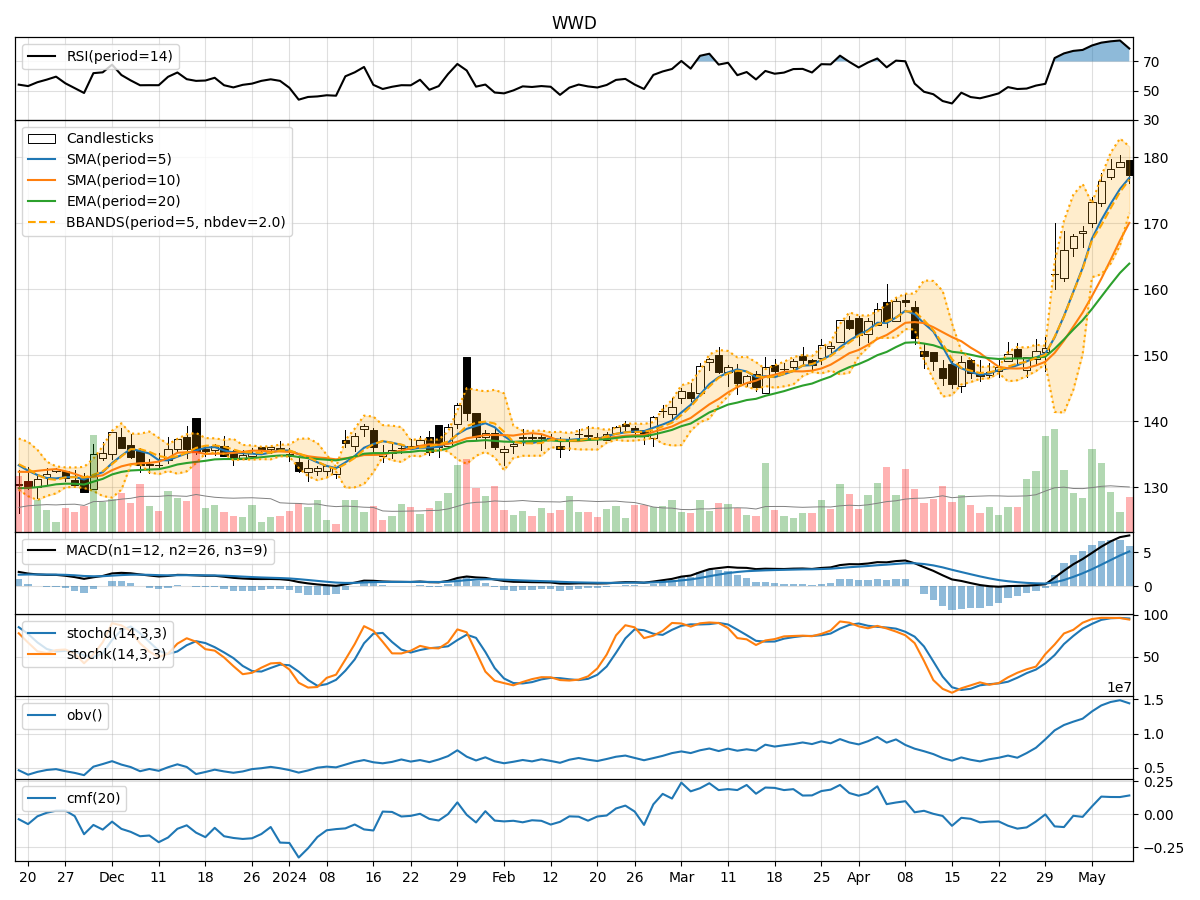
In analyzing the technical indicators for WWD over the last 5 days, we will delve into the trend, momentum, volatility, and volume indicators to provide a comprehensive outlook on the possible stock price movement. By examining these key aspects, we aim to offer valuable insights and predictions for the upcoming days.
Trend Analysis:
- Moving Averages (MA): The 5-day Moving Average has been consistently rising, indicating a bullish trend in the short term.
- MACD: The MACD line has been increasing, crossing above the signal line, suggesting a strengthening bullish momentum.
- EMA: The Exponential Moving Average has been trending upwards, supporting the bullish sentiment in the stock.
Momentum Analysis:
- RSI: The Relative Strength Index has been in the overbought territory, signaling a strong bullish momentum.
- Stochastic Oscillator: Both %K and %D have been high, indicating an overbought condition.
- Williams %R: The indicator has been in the oversold region, suggesting a potential reversal in the short term.
Volatility Analysis:
- Bollinger Bands: The stock price has been trading near the upper Bollinger Band, indicating high volatility and a potential overbought condition.
- Bollinger %B: The %B indicator is above 0.8, suggesting a possible overbought situation.
Volume Analysis:
- On-Balance Volume (OBV): The OBV has been increasing, reflecting strong buying pressure in the stock.
- Chaikin Money Flow (CMF): The CMF has been positive, indicating that money is flowing into the stock.
Key Observations:
- The stock is currently in a strong bullish trend based on moving averages and MACD.
- Momentum indicators suggest an overbought condition, which could lead to a potential pullback.
- Volatility is high, indicating increased price fluctuations.
- Volume indicators show strong buying interest in the stock.
Conclusion:
Based on the analysis of the technical indicators, the stock is likely to experience a short-term pullback or consolidation due to the overbought momentum signals and high volatility. Traders should exercise caution and consider taking profits or waiting for a better entry point. However, the overall trend remains bullish, so any pullback could present a buying opportunity for long-term investors. Keep a close watch on key support levels and monitor for potential reversal signals before making trading decisions.