Technical Analysis of XNET 2024-05-10
Overview:
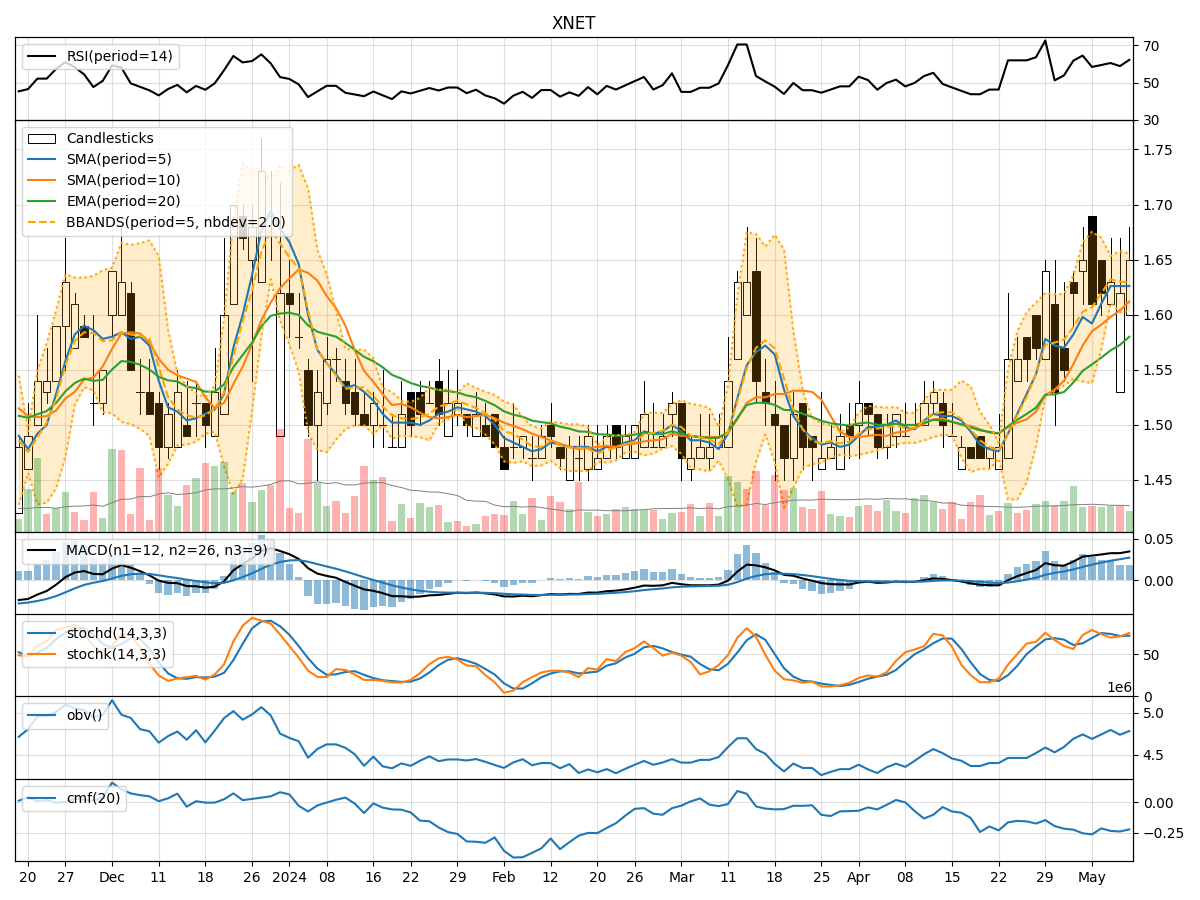
In analyzing the technical indicators for XNET over the last 5 days, we will delve into the trend, momentum, volatility, and volume indicators to provide a comprehensive outlook on the possible stock price movement. By examining these key factors, we aim to offer valuable insights and predictions for the upcoming days.
Trend Indicators:
- Moving Averages (MA): The 5-day moving average has been consistently increasing, indicating a bullish trend in the short term.
- MACD: The MACD line has been rising steadily, with the MACD histogram also showing positive values, suggesting bullish momentum.
- EMA: The exponential moving average has been trending upwards, supporting the bullish sentiment in the stock.
Momentum Indicators:
- RSI: The Relative Strength Index has been fluctuating around the 60 level, indicating moderate momentum without being overbought or oversold.
- Stochastic Oscillator: Both %K and %D lines of the Stochastic Oscillator have been in the overbought territory, suggesting a potential reversal or consolidation.
- Williams %R: The Williams %R is hovering around -20, indicating a near-overbought condition.
Volatility Indicators:
- Bollinger Bands: The Bollinger Bands have been narrowing, indicating decreasing volatility and a potential upcoming breakout.
- Bollinger %B: The %B indicator has been fluctuating within a range, suggesting a period of consolidation.
- Average True Range (ATR): ATR has been relatively stable, indicating consistent price movements without significant spikes.
Volume Indicators:
- On-Balance Volume (OBV): The OBV has been fluctuating, indicating mixed buying and selling pressure.
- Chaikin Money Flow (CMF): The CMF has been negative, suggesting outflow of money from the stock.
Key Observations and Opinions:
- Trend: The trend indicators point towards a bullish sentiment in the short term, supported by the moving averages and MACD.
- Momentum: Momentum indicators show mixed signals, with the Stochastic Oscillator hinting at a potential reversal.
- Volatility: Volatility indicators suggest a period of consolidation with a potential breakout in the near future.
- Volume: Volume indicators reflect mixed trading activity, with no clear direction in buying or selling pressure.
Conclusion:
Based on the analysis of the technical indicators, the next few days for XNET could see sideways consolidation with a potential bullish breakout. Traders should closely monitor the Stochastic Oscillator for a possible reversal signal and the Bollinger Bands for a breakout confirmation. It is advisable to wait for clearer signals before making significant trading decisions.