Technical Analysis of XRAY 2024-05-10
Overview:
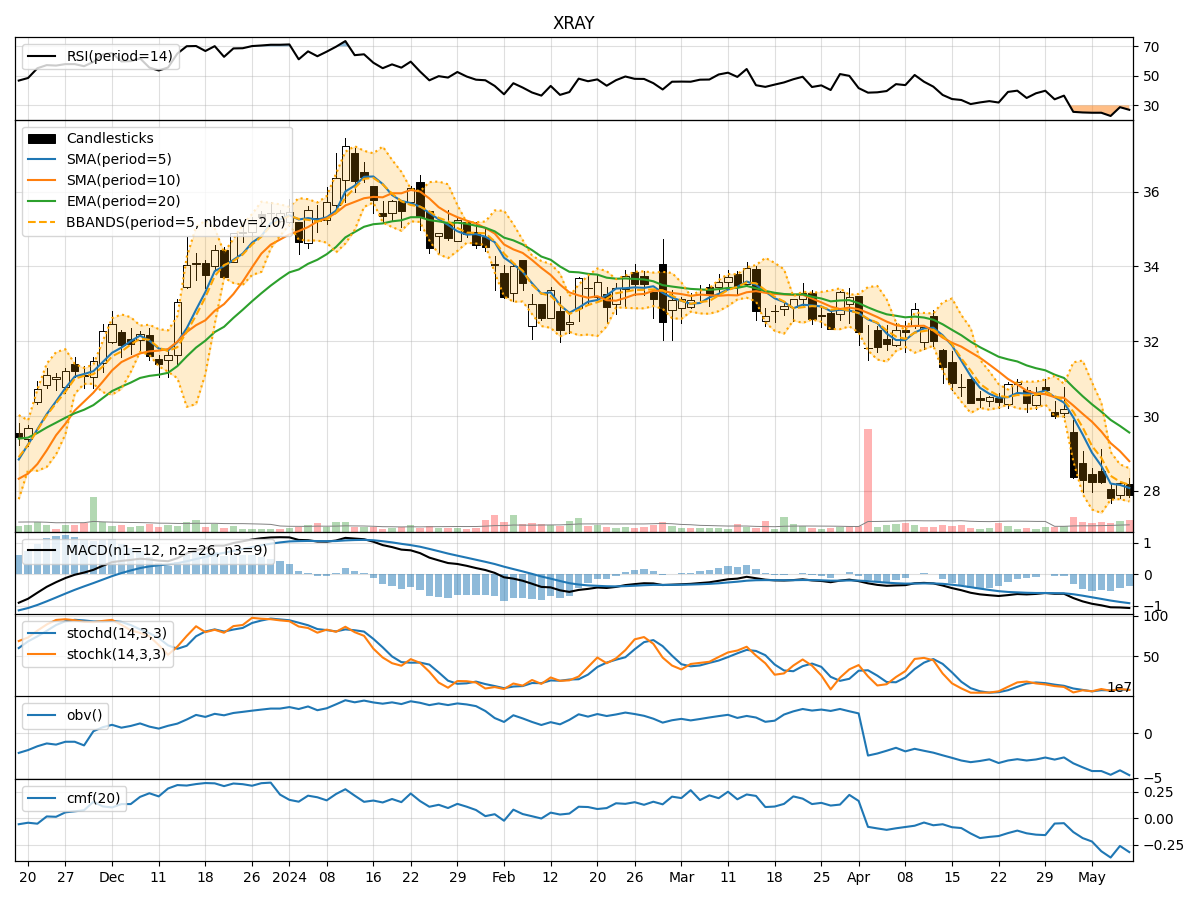
In analyzing the technical indicators for XRAY stock over the last 5 days, we will delve into the trend, momentum, volatility, and volume indicators to provide a comprehensive outlook on the possible future stock price movement. By examining key metrics such as moving averages, MACD, RSI, Bollinger Bands, and OBV, we aim to offer valuable insights and recommendations for potential trading strategies.
Trend Analysis:
- Moving Averages (MA): The 5-day MA has been consistently below the longer-term SMAs and EMAs, indicating a downward trend in the stock price.
- MACD: The MACD line has been below the signal line, with negative values, suggesting bearish momentum in the short term.
Momentum Analysis:
- RSI: The RSI values have been relatively low, indicating oversold conditions and potential for a reversal or bounce in the stock price.
- Stochastic Oscillator: Both %K and %D values have been in the oversold territory, signaling a possible upcoming bullish momentum.
Volatility Analysis:
- Bollinger Bands (BB): The stock price has been consistently trading below the middle Bollinger Band, indicating a downtrend with lower volatility.
Volume Analysis:
- On-Balance Volume (OBV): The OBV values have been negative, suggesting distribution and selling pressure in the stock.
- Chaikin Money Flow (CMF): The CMF values have been negative, indicating outflow of money from the stock.
Key Observations:
- The stock is currently in a downtrend based on moving averages and MACD.
- Momentum indicators like RSI and Stochastic Oscillator suggest a potential reversal due to oversold conditions.
- Volatility is low, as indicated by Bollinger Bands, signaling a lack of significant price fluctuations.
- Volume indicators show selling pressure with negative OBV and CMF values.
Conclusion:
Based on the technical analysis of XRAY stock, the next few days are likely to see a potential reversal in the stock price. The oversold conditions indicated by momentum indicators suggest a possible bounce or uptrend. However, the overall trend remains bearish based on moving averages and MACD. Traders should closely monitor key support and resistance levels for confirmation of a trend reversal. Exercise caution and consider implementing risk management strategies in trading decisions.