Technical Analysis of XRX 2024-05-10
Overview:
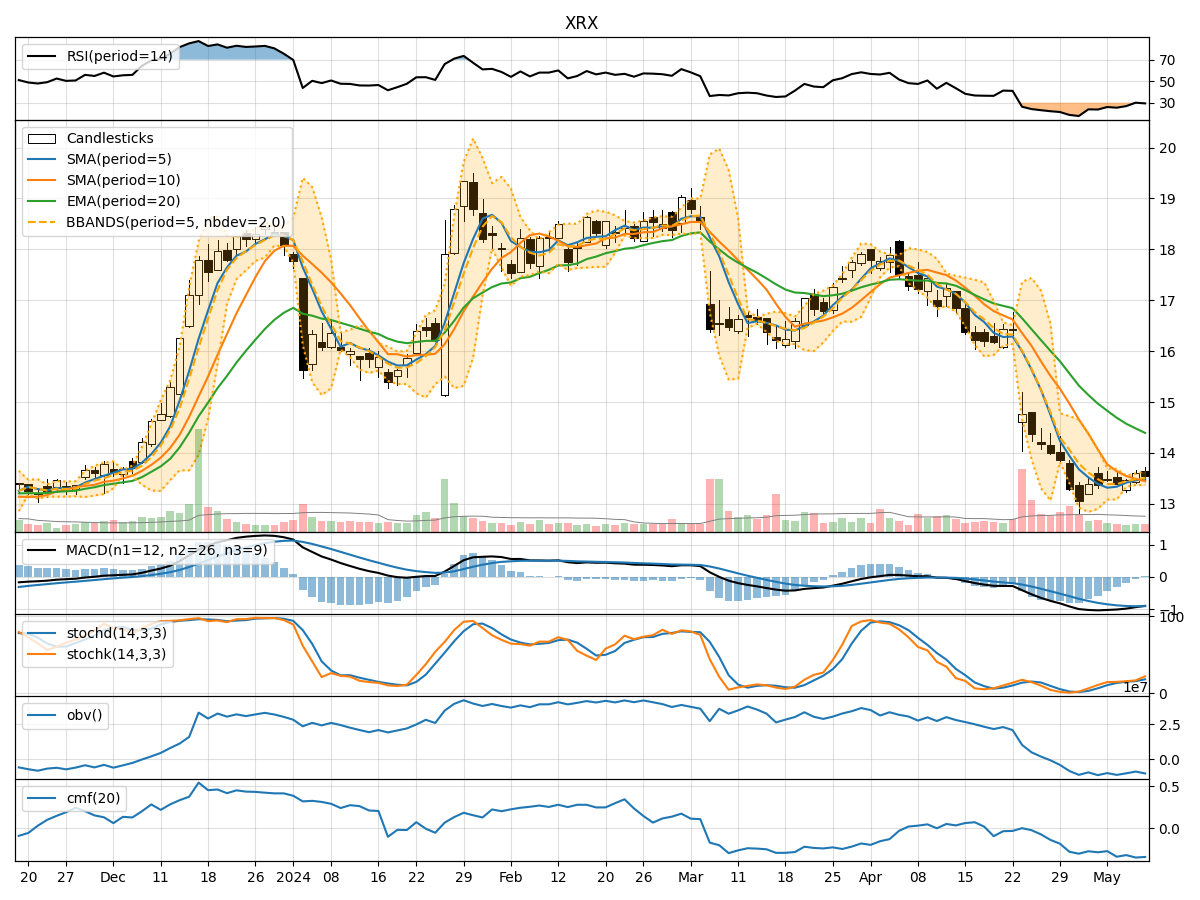
In analyzing the technical indicators for XRX over the last 5 days, we will delve into the trend, momentum, volatility, and volume indicators to provide a comprehensive outlook on the possible stock price movement. By examining these key aspects, we aim to offer valuable insights and predictions for the upcoming days.
Trend Analysis:
- Moving Averages (MA): The 5-day Moving Average (MA) has been fluctuating around the closing prices, indicating short-term price trends. The Simple Moving Average (SMA) and Exponential Moving Average (EMA) suggest a downward trend, with the EMA showing a more pronounced decline.
- MACD: The Moving Average Convergence Divergence (MACD) has been negative, indicating bearish momentum in the stock price.
Momentum Analysis:
- RSI: The Relative Strength Index (RSI) has been below 30, indicating oversold conditions in the stock. This could potentially lead to a reversal in the price trend.
- Stochastic Oscillator: Both %K and %D have been increasing, suggesting a potential bullish momentum building up.
Volatility Analysis:
- Bollinger Bands (BB): The Bollinger Bands have been narrowing, indicating reduced volatility in the stock price. This could precede a breakout or a significant price movement.
Volume Analysis:
- On-Balance Volume (OBV): The OBV has been negative, indicating selling pressure in the stock. This could potentially lead to further downside movement.
- Chaikin Money Flow (CMF): The CMF has been negative, suggesting that money is flowing out of the stock.
Key Observations:
- The stock is currently in a downtrend based on moving averages and MACD.
- Momentum indicators like RSI and Stochastic Oscillator show potential for a bullish reversal.
- Volatility is decreasing, indicating a possible consolidation phase.
- Volume indicators suggest selling pressure and outflow of money from the stock.
Conclusion:
Based on the analysis of technical indicators, the next few days for XRX could see a potential bullish reversal in the stock price. While the trend and volume indicators point towards a bearish sentiment, the momentum indicators suggest a shift towards bullish momentum. The decreasing volatility may lead to a consolidation phase before a potential breakout. Traders should closely monitor the price action and key levels for confirmation of the anticipated reversal.