Technical Analysis of XYLO 2024-05-10
Overview:
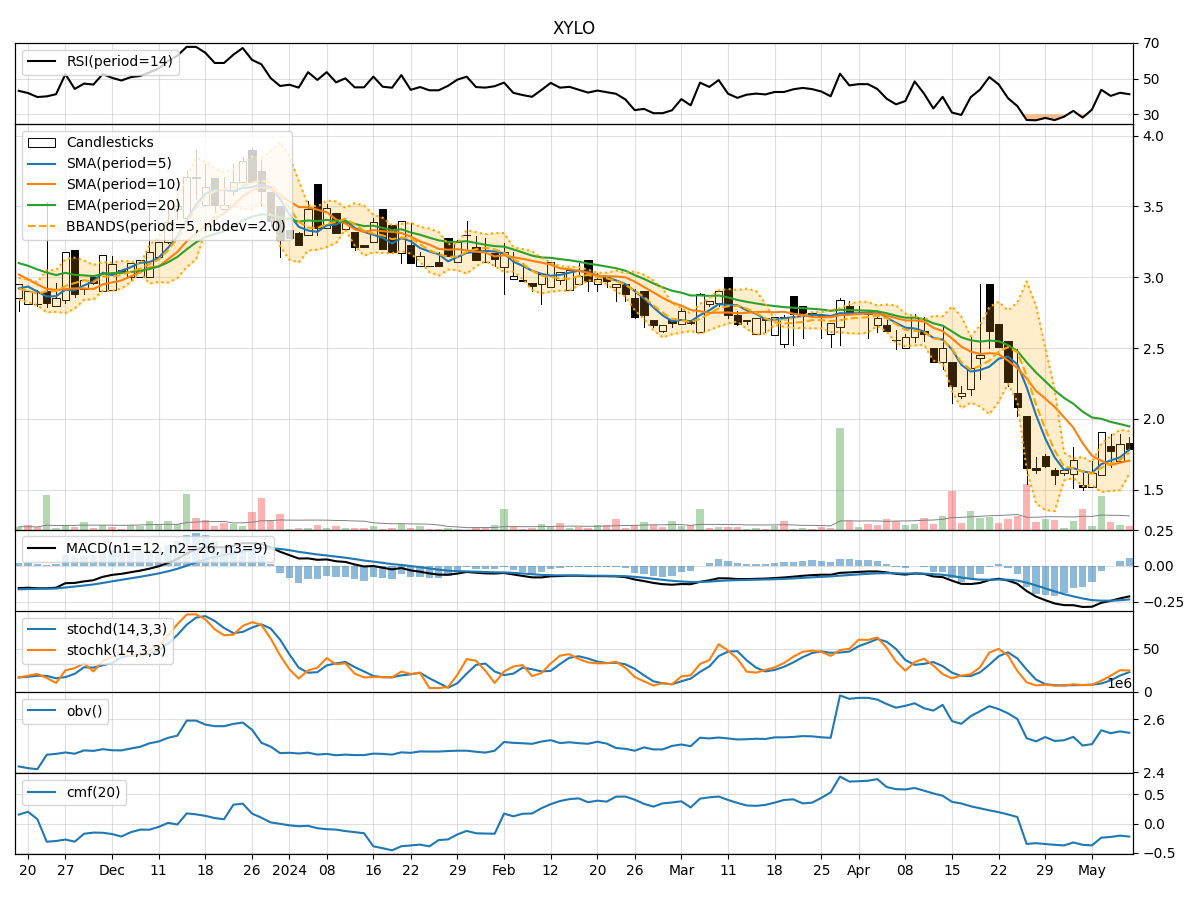
In analyzing the technical indicators for XYLO stock over the last 5 days, we will delve into the trends, momentum, volatility, and volume aspects to provide a comprehensive outlook on the possible stock price movement in the coming days. By examining key indicators such as moving averages, MACD, RSI, Bollinger Bands, and OBV, we aim to offer valuable insights and predictions for potential investors.
Trend Analysis:
- Moving Averages (MA): The 5-day moving average has been fluctuating around the actual closing prices, indicating short-term price trends.
- MACD: The MACD line has been consistently below the signal line, suggesting a bearish momentum in the stock.
- EMA: The exponential moving average has been declining, reflecting a downward trend in the stock price.
Momentum Analysis:
- RSI: The Relative Strength Index has been hovering around the mid-range, indicating a neutral momentum in the stock.
- Stochastic Oscillator: Both %K and %D have been fluctuating, showing indecision in the momentum.
- Williams %R: The Williams %R is in oversold territory, suggesting a potential reversal in the momentum.
Volatility Analysis:
- Bollinger Bands: The stock price has been trading within the Bollinger Bands, indicating a period of consolidation.
- Bollinger %B: The %B indicator has been relatively stable, suggesting a lack of significant volatility in the stock.
Volume Analysis:
- On-Balance Volume (OBV): The OBV has been fluctuating, indicating mixed buying and selling pressure in the stock.
- Chaikin Money Flow (CMF): The CMF has been negative, suggesting a net outflow of money from the stock.
Key Observations:
- The stock is currently in a consolidation phase, as indicated by the trading within the Bollinger Bands and the lack of significant volatility.
- The momentum indicators show mixed signals, with the RSI indicating neutrality and the Stochastic Oscillator showing indecision.
- The volume indicators suggest a balance between buying and selling pressure, with a slight negative bias.
Conclusion:
Based on the analysis of the technical indicators, the next few days for XYLO stock are likely to see sideways movement with a slight bearish bias. Investors should exercise caution and closely monitor the price action for any potential breakout or trend reversal. It is advisable to wait for more clarity in the indicators before making any significant trading decisions.