Technical Analysis of YJ 2024-05-10
Overview:
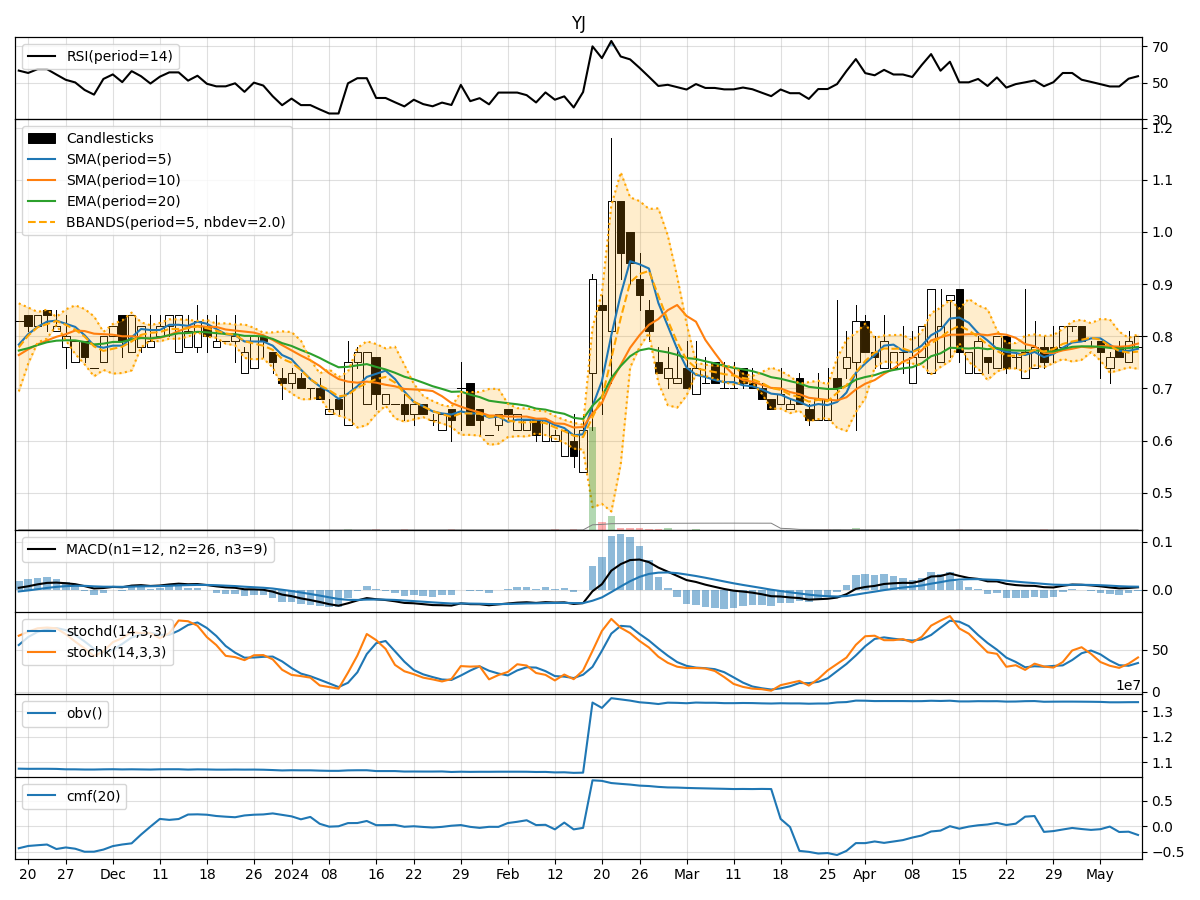
In analyzing the technical indicators for YJ stock over the last 5 days, we will delve into the trend, momentum, volatility, and volume indicators to provide a comprehensive outlook on the possible stock price movement in the coming days. By examining these key aspects, we aim to offer valuable insights and predictions for potential investors.
Trend Analysis:
- Moving Averages (MA): The 5-day MA has been fluctuating around the closing prices, indicating short-term price trends. The stock has been trading close to the 5-day MA.
- MACD: The MACD line has been positive, suggesting a bullish momentum in the stock price.
- EMA: The EMA has been slightly increasing, indicating a positive trend in the stock price.
Momentum Analysis:
- RSI: The RSI has been hovering around the mid-level, indicating a neutral momentum in the stock.
- Stochastic Oscillator: Both %K and %D have been fluctuating, suggesting indecision in the stock's momentum.
- Williams %R: The Williams %R has been moving towards oversold levels, indicating a potential reversal in the stock price.
Volatility Analysis:
- Bollinger Bands (BB): The stock price has been trading within the bands, indicating moderate volatility.
- BB Width: The BB width has been fluctuating, suggesting varying levels of volatility in the stock price.
Volume Analysis:
- On-Balance Volume (OBV): The OBV has been relatively stable, indicating consistent buying and selling pressure.
- Chaikin Money Flow (CMF): The CMF has been negative, suggesting a bearish money flow in the stock.
Key Observations:
- The stock is currently trading around the 5-day MA, indicating a short-term support level.
- The MACD is positive, suggesting a bullish momentum in the stock price.
- The RSI and Stochastic Oscillator indicate a neutral momentum, while the Williams %R points towards a potential oversold condition.
- The Bollinger Bands show moderate volatility, with the stock price trading within the bands.
- The OBV reflects stable buying and selling pressure, while the CMF indicates a bearish money flow.
Conclusion:
Based on the analysis of the technical indicators, the stock price of YJ is likely to experience a period of consolidation in the coming days. The bullish momentum indicated by the MACD may be offset by the neutral to slightly bearish signals from the RSI, Stochastic Oscillator, and CMF. The stock is expected to trade within a range, with potential support at the 5-day MA level. Traders should exercise caution and wait for clearer signals before making significant trading decisions.