Technical Analysis of YQ 2024-05-10
Overview:
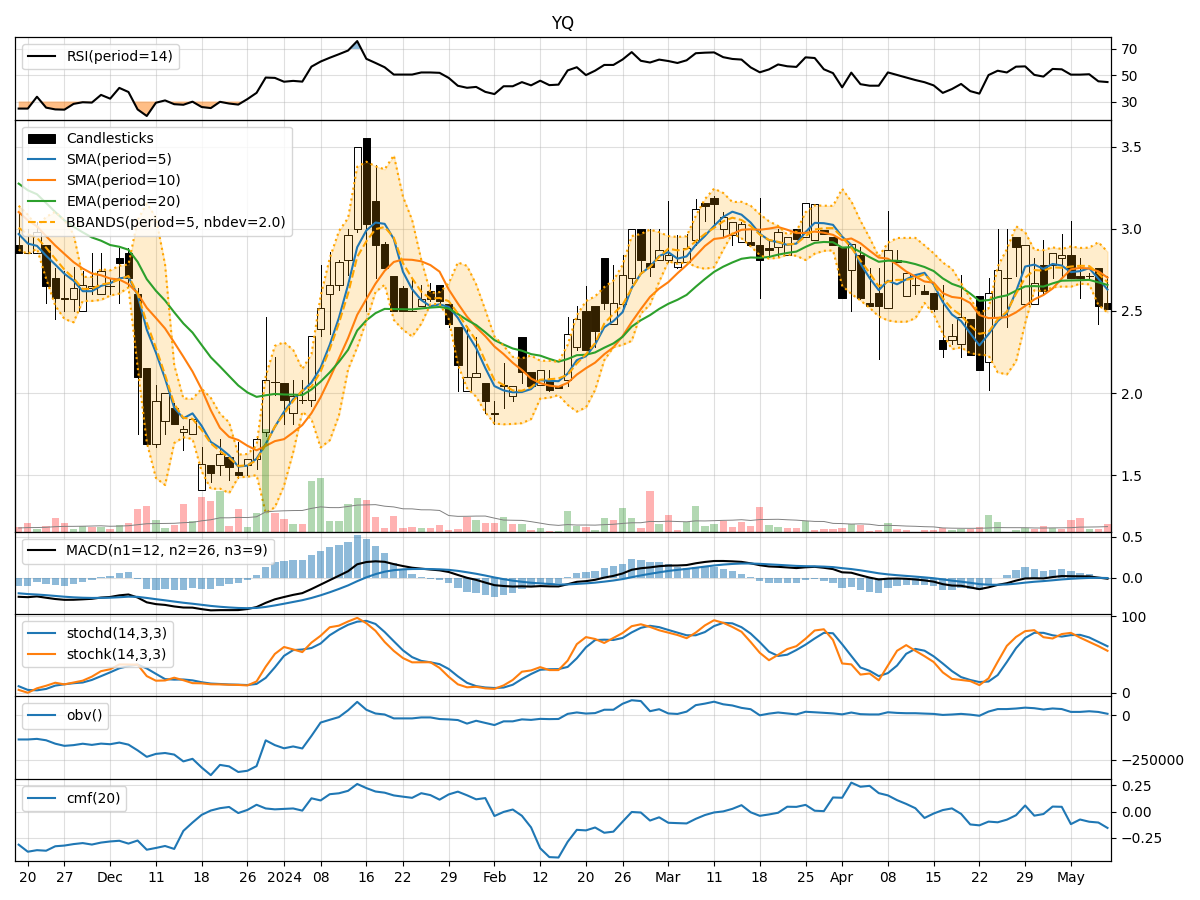
In analyzing the technical indicators for YQ stock over the last 5 days, we will delve into the trend, momentum, volatility, and volume indicators to provide a comprehensive outlook on the possible stock price movement in the coming days. By examining these key indicators, we aim to offer valuable insights and predictions for potential investors.
Trend Analysis:
- Moving Averages (MA): The 5-day MA has been declining, indicating a short-term bearish trend.
- MACD: The MACD line has been below the signal line, suggesting a bearish momentum.
- EMA: The EMA has been relatively stable, showing a lack of strong directional bias.
Key Observation: The trend indicators point towards a bearish sentiment in the short term.
Momentum Analysis:
- RSI: The RSI has been decreasing, indicating a weakening momentum.
- Stochastic Oscillator: Both %K and %D have been declining, signaling a bearish momentum.
- Williams %R: The indicator has been in oversold territory, suggesting a potential reversal.
Key Observation: Momentum indicators align with the trend indicators, indicating a bearish momentum in the near future.
Volatility Analysis:
- Bollinger Bands (BB): The bands have been narrowing, indicating decreasing volatility.
- Bollinger %B: The %B has been decreasing, signaling a potential consolidation phase.
Key Observation: Volatility indicators suggest a period of consolidation or a potential decrease in price fluctuations.
Volume Analysis:
- On-Balance Volume (OBV): The OBV has been declining, indicating selling pressure.
- Chaikin Money Flow (CMF): The CMF has been negative, suggesting a lack of buying interest.
Key Observation: Volume indicators support the bearish sentiment, showing a decrease in buying interest and increasing selling pressure.
Conclusion:
Based on the analysis of trend, momentum, volatility, and volume indicators, the overall outlook for YQ stock in the next few days is bearish. The technical indicators collectively suggest a continuation of the current downward trend with a potential consolidation phase due to decreasing volatility. Investors should exercise caution and consider waiting for more positive signals before considering any long positions.
Key Conclusion:
The stock is likely to experience further downward movement in the coming days, with a possibility of entering a consolidation phase. It is advisable to monitor the indicators closely for any signs of a trend reversal before considering any bullish positions.