Technical Analysis of YS 2024-05-10
Overview:
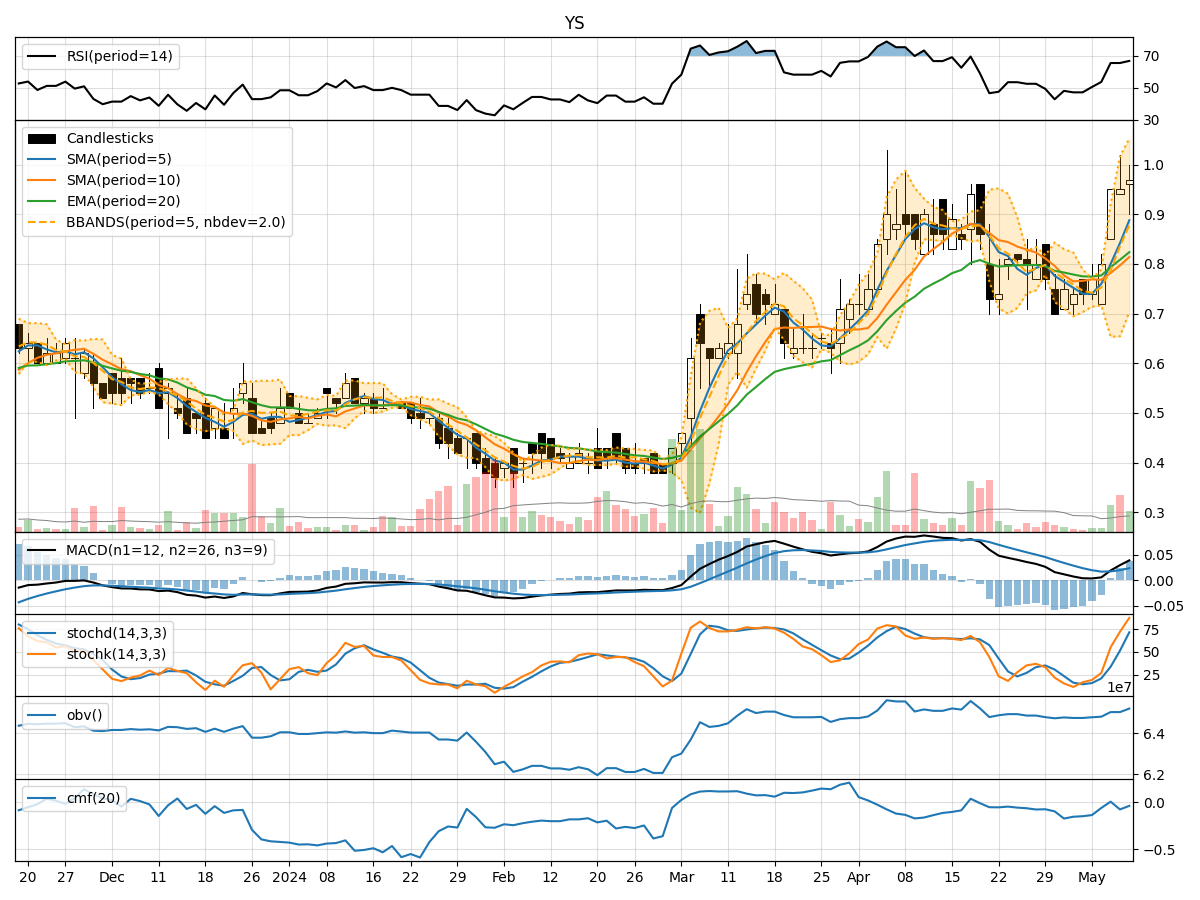
In analyzing the technical indicators for YS stock over the last 5 days, we will delve into the trend, momentum, volatility, and volume indicators to provide a comprehensive outlook on the possible stock price movement in the coming days. By examining these key indicators, we aim to offer valuable insights and predictions to guide investment decisions.
Trend Analysis:
- Moving Averages (MA): The 5-day Moving Average (MA) has been consistently rising, indicating an upward trend in the stock price.
- MACD: The MACD line has been steadily increasing, with the MACD histogram also showing positive values, suggesting bullish momentum.
Momentum Analysis:
- RSI: The Relative Strength Index (RSI) has been trending upwards, indicating increasing buying pressure.
- Stochastic Oscillator: Both %K and %D lines of the Stochastic Oscillator are in the overbought zone, signaling a potential reversal or consolidation.
Volatility Analysis:
- Bollinger Bands (BB): The Bollinger Bands have been widening, suggesting increased volatility in the stock price.
Volume Analysis:
- On-Balance Volume (OBV): The OBV indicator has been relatively flat, indicating a balance between buying and selling pressure.
- Chaikin Money Flow (CMF): The CMF has been negative, reflecting a lack of strong buying interest.
Key Observations:
- The stock is currently in an upward trend based on moving averages and MACD.
- Momentum indicators like RSI show bullish momentum in the stock.
- Volatility is increasing, as seen in the widening Bollinger Bands.
- Volume indicators suggest a neutral stance with balanced buying and selling pressure.
Conclusion:
Based on the analysis of technical indicators, the next few days for YS stock are likely to see continued upward movement in price, supported by the positive trend and momentum signals. However, caution is advised as the Stochastic Oscillator indicates the stock is in the overbought zone, which could lead to a potential consolidation or pullback in the short term. Traders should closely monitor price action and key support levels for any signs of reversal.