Technical Analysis of YY 2024-05-10
Overview:
In analyzing the technical indicators for YY stock over the last 5 days, we will delve into the trends, momentum, volatility, and volume aspects to provide a comprehensive outlook on the possible stock price movement in the coming days. By examining key indicators such as moving averages, MACD, RSI, Bollinger Bands, and OBV, we aim to offer valuable insights and predictions for potential price trends.
Trend Analysis:
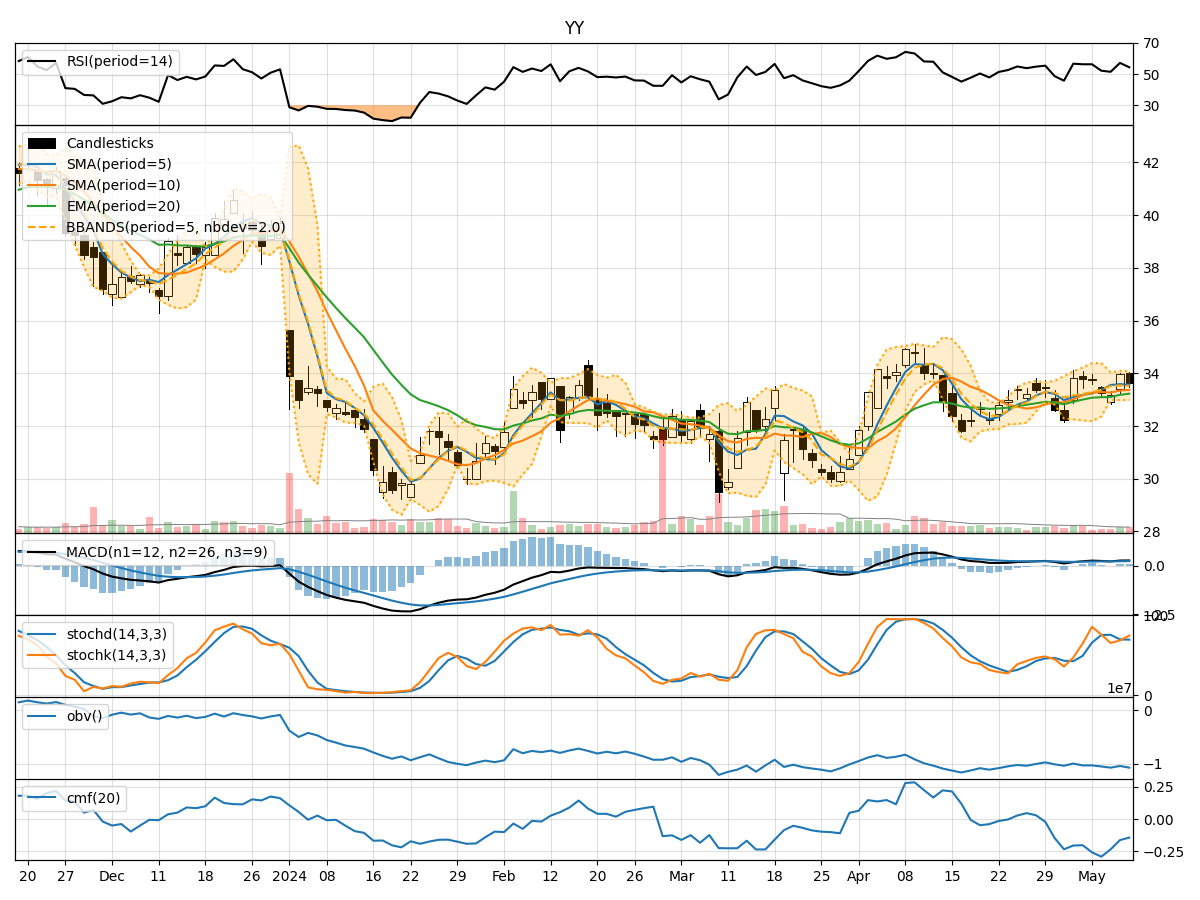
- Moving Averages (MA): The 5-day MA has been fluctuating around the closing prices, indicating short-term price trends. The SMA(10) and EMA(20) have shown slight variations but have not diverged significantly.
- MACD: The MACD line has been positive, indicating a bullish trend, with the MACD histogram showing a slight increase over the past few days.
Momentum Analysis:
- RSI: The RSI values have been fluctuating around the mid-range, suggesting a balanced momentum without extreme overbought or oversold conditions.
- Stochastic Oscillator: Both %K and %D values have been oscillating within a neutral range, indicating a lack of strong momentum in either direction.
Volatility Analysis:
- Bollinger Bands (BB): The stock price has been trading within the Bollinger Bands, with the bands narrowing slightly over the last few days, indicating decreasing volatility.
- Bollinger Band %B: The %B values have been hovering around the midline, suggesting a neutral stance in terms of volatility.
Volume Analysis:
- On-Balance Volume (OBV): The OBV values have shown a slight decline over the last few days, indicating a decrease in buying pressure.
- Chaikin Money Flow (CMF): The CMF values have been negative, reflecting a lack of strong inflow of money into the stock.
Conclusion:
Based on the analysis of the technical indicators, the stock is likely to experience sideways movement in the coming days. The lack of strong trends in the moving averages, neutral momentum signals from RSI and Stochastic Oscillator, decreasing volatility as indicated by Bollinger Bands, and the decline in OBV and negative CMF values suggest a period of consolidation or range-bound trading.
Key Conclusion: The stock is expected to trade within a narrow range with no clear directional bias. Traders may consider adopting a range-bound strategy or wait for a clearer trend to emerge before taking significant positions.