Technical Analysis of ZENV 2024-05-10
Overview:
In analyzing the technical indicators for ZENV stock over the last 5 days, we will delve into the trend, momentum, volatility, and volume indicators to provide a comprehensive outlook on the possible stock price movement in the coming days. By examining these key indicators, we aim to offer valuable insights and predictions to guide investment decisions.
Trend Analysis:
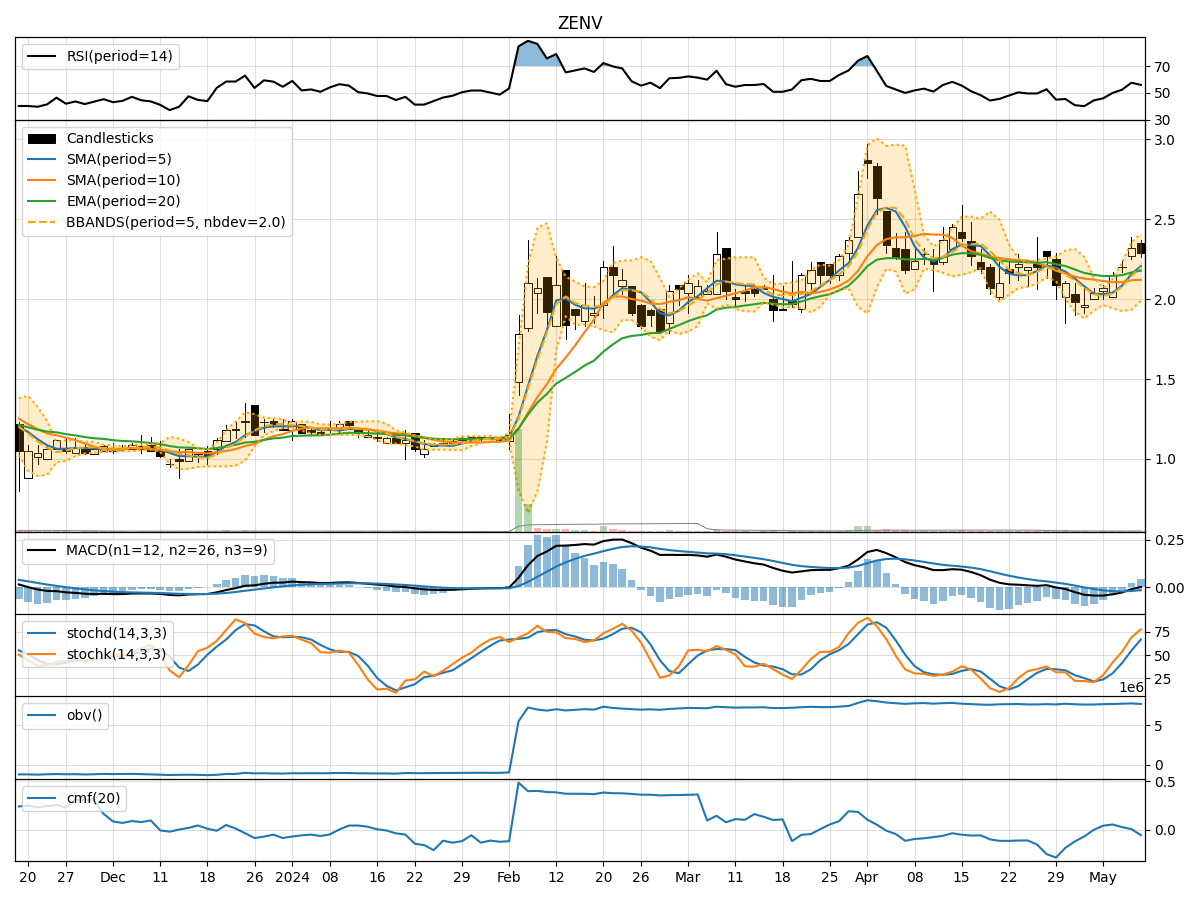
- Moving Averages (MA): The 5-day Moving Average (MA) has been showing an upward trend, indicating a positive momentum in the stock price.
- MACD (Moving Average Convergence Divergence): The MACD has been consistently negative but showing signs of convergence towards the signal line, suggesting a potential reversal in the trend.
- RSI (Relative Strength Index): The RSI has been fluctuating around the neutral zone, indicating a balanced momentum in the stock.
Momentum Analysis:
- Stochastic Oscillator: The Stochastic Oscillator is in the overbought zone, suggesting a potential reversal or consolidation in the stock price.
- Williams %R (Willr): The Williams %R is in the oversold territory, indicating a possible buying opportunity for traders.
Volatility Analysis:
- Bollinger Bands (BB): The Bollinger Bands have been widening, indicating increased volatility in the stock price.
- Average True Range (ATR): The ATR has shown an uptrend, suggesting an increase in volatility in the stock.
Volume Analysis:
- On-Balance Volume (OBV): The OBV has been fluctuating, indicating mixed sentiment among investors regarding the stock.
- Chaikin Money Flow (CMF): The CMF has been positive but declining, signaling a potential outflow of money from the stock.
Key Observations:
- The stock is currently in a consolidation phase, with mixed signals from different indicators.
- The trend is slightly bullish, supported by the moving averages, but the momentum indicators suggest a possible reversal or consolidation.
- Volatility has been increasing, indicating potential price swings in the coming days.
- Volume indicators show mixed sentiment among investors, with no clear direction in terms of buying or selling pressure.
Conclusion:
Based on the analysis of the technical indicators, the next few days' possible stock price movement for ZENV is sideways consolidation with a slight upward bias. Traders should exercise caution and wait for clearer signals from the indicators before making significant trading decisions. It is advisable to closely monitor the trend, momentum, volatility, and volume indicators for any shifts in market sentiment that could impact the stock price movement.