Technical Analysis of ZG 2024-05-10
Overview:
In analyzing the technical indicators for ZG over the last 5 days, we will delve into the trend, momentum, volatility, and volume indicators to provide a comprehensive outlook on the possible stock price movement in the coming days. By examining these key aspects, we aim to offer valuable insights and recommendations for potential investors.
Trend Analysis:
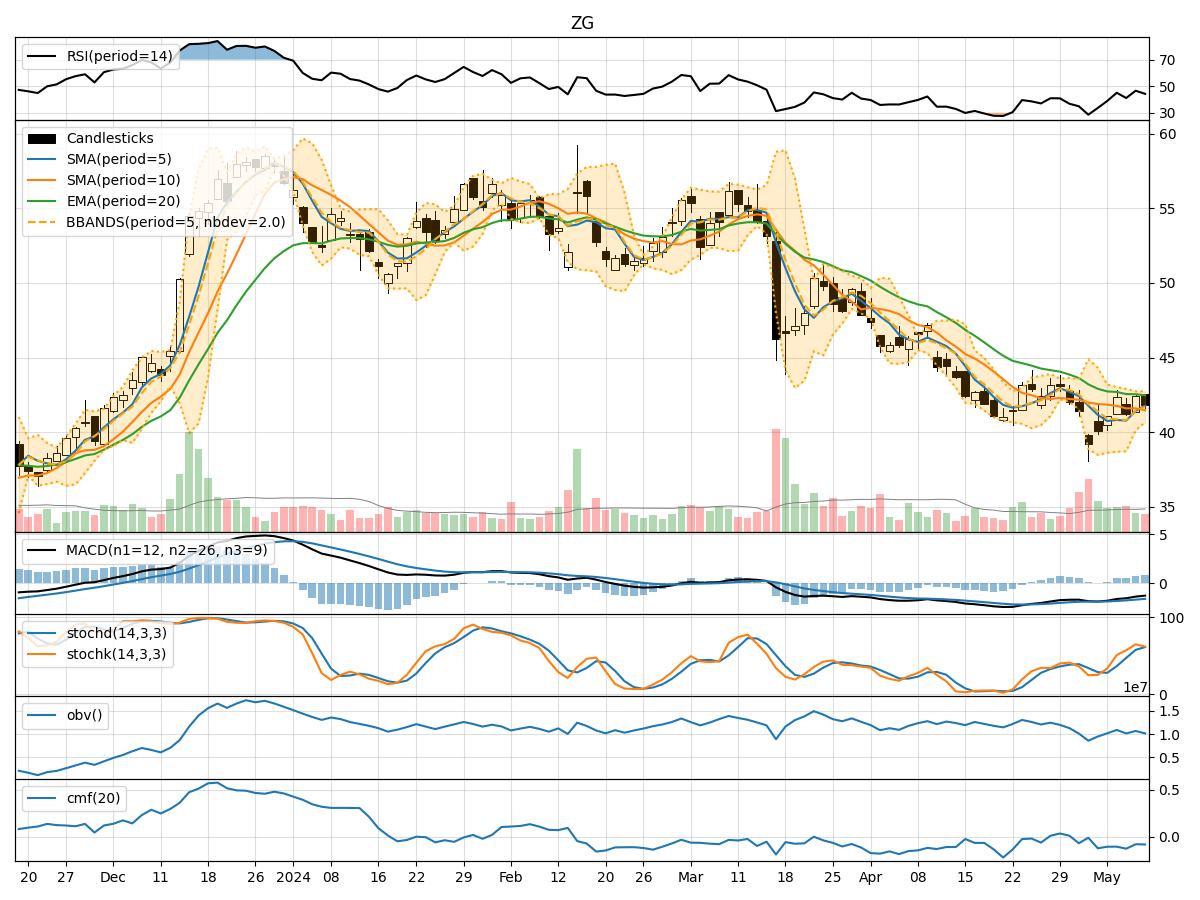
- Moving Averages (MA): The 5-day Moving Average (MA) has been fluctuating around the closing prices, indicating short-term price trends. The Simple Moving Average (SMA) and Exponential Moving Average (EMA) show a downward trend, suggesting a bearish sentiment.
- MACD: The Moving Average Convergence Divergence (MACD) has been negative, with the MACD line consistently below the signal line. This indicates a bearish momentum in the stock price.
- Conclusion: The trend indicators point towards a bearish outlook for ZG in the near term.
Momentum Analysis:
- RSI: The Relative Strength Index (RSI) has been fluctuating but remains below the overbought threshold of 70, indicating a neutral to slightly bearish momentum.
- Stochastic Oscillator: Both %K and %D lines of the Stochastic Oscillator have been in the overbought zone, suggesting a potential reversal in price direction.
- Conclusion: The momentum indicators signal a neutral to bearish sentiment for ZG.
Volatility Analysis:
- Bollinger Bands (BB): The Bollinger Bands have shown narrowing volatility, with the stock price moving closer to the lower band. This could indicate a potential price breakout in the near future.
- Conclusion: Volatility indicators suggest a potential price breakout for ZG.
Volume Analysis:
- On-Balance Volume (OBV): The OBV has been fluctuating, indicating indecision among investors regarding the stock.
- Chaikin Money Flow (CMF): The CMF has been negative, reflecting selling pressure in the stock.
- Conclusion: Volume indicators show mixed signals for ZG, with no clear direction.
Overall Conclusion:
Based on the analysis of trend, momentum, volatility, and volume indicators, the overall outlook for ZG in the next few days is bearish. The trend indicators suggest a downward trajectory, while momentum indicators lean towards a neutral to bearish sentiment. Volatility indicators hint at a potential breakout, and volume indicators show mixed signals.
Recommendation:
Considering the comprehensive analysis of technical indicators, investors should exercise caution when trading ZG in the coming days. It is advisable to closely monitor price movements, especially for signs of a breakout indicated by volatility indicators. Traders may consider short-term bearish strategies or wait for more clarity in the market before making significant investment decisions.
Key Takeaways:
- Trend: Bearish
- Momentum: Neutral to Bearish
- Volatility: Potential Breakout
- Volume: Mixed Signals
Actionable Insights:
- Monitor price movements closely for a potential breakout.
- Consider short-term bearish strategies.
- Stay updated on market developments to make informed decisions.
By incorporating these insights into your trading strategy, you can navigate the market dynamics surrounding ZG more effectively and make well-informed investment decisions.