Technical Analysis of ZS 2024-05-10
Overview:
In analyzing the technical indicators for ZS over the last 5 days, we will delve into the trend, momentum, volatility, and volume indicators to provide a comprehensive outlook on the possible stock price movement in the coming days. By examining these key indicators, we aim to offer valuable insights and predictions for informed decision-making.
Trend Indicators:
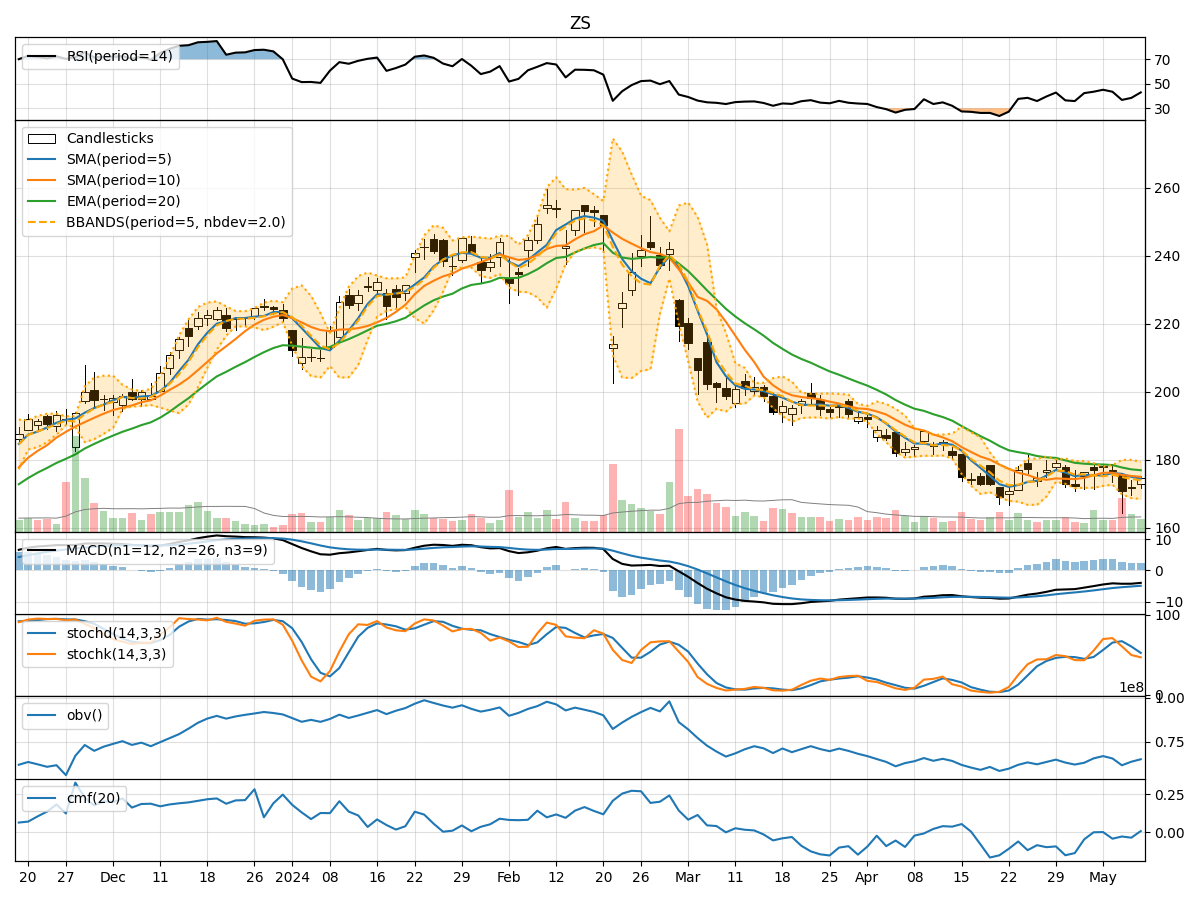
- Moving Averages (MA): The 5-day MA has been fluctuating around the closing prices, indicating short-term price trends. The SMA(10) and EMA(20) show a downward trend, suggesting a bearish sentiment in the medium to long term.
- MACD: The MACD line has been negative, indicating a bearish trend. The MACD Histogram has been decreasing, signaling a weakening bearish momentum.
Momentum Indicators:
- RSI: The RSI has been below 50, indicating a bearish momentum in the stock. It has room for potential downside movement.
- Stochastic Oscillator: Both %K and %D have been declining, suggesting a bearish sentiment. The stock is approaching oversold conditions.
- Williams %R: The indicator has been in the oversold territory, indicating a potential reversal or consolidation.
Volatility Indicators:
- Bollinger Bands: The stock price has been trading within the lower Bollinger Band, indicating oversold conditions. The bands are narrowing, suggesting a potential breakout or reversal.
- Bollinger %B: The %B indicator is below 1, indicating the stock is trading below the lower band, signaling a possible oversold condition.
Volume Indicators:
- On-Balance Volume (OBV): The OBV has been declining, indicating selling pressure in the stock. This aligns with the bearish sentiment seen in other indicators.
- Chaikin Money Flow (CMF): The CMF has been negative, indicating outflow of money from the stock. This reflects bearish sentiment among investors.
Conclusion:
Based on the analysis of the technical indicators, the overall outlook for ZS in the next few days is bearish. The trend indicators show a downward trajectory, supported by negative momentum and volume indicators. The stock is currently oversold based on volatility indicators, which could lead to a potential reversal or consolidation in the near term. However, the prevailing bearish sentiment suggests that any upside movement may be limited.
Recommendation:
Considering the bearish outlook, investors may consider adopting a cautious approach towards ZS in the coming days. It is advisable to closely monitor key support levels and wait for confirmation of a trend reversal before considering any long positions. Short-term traders may explore opportunities to capitalize on potential downside movements with appropriate risk management strategies in place.