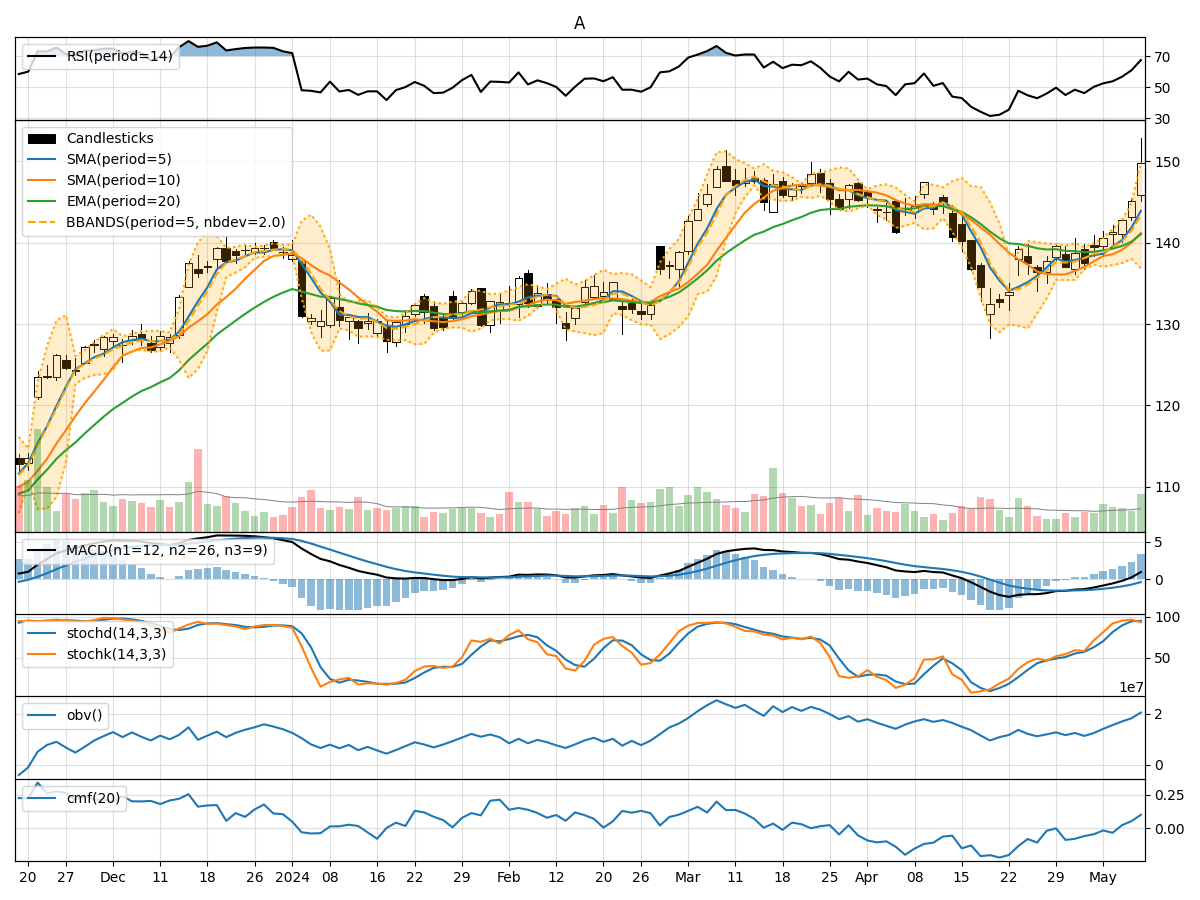
Technical Analysis of A 2024-05-10
Overview:
In analyzing the provided Technical Analysis (TA) data for the last 5 days, we will delve into the trend, momentum, volatility, and volume indicators to forecast the possible stock price movement for the next few days. By examining these key indicators, we aim to provide a comprehensive and insightful prediction backed by data-driven analysis.
Trend Indicators:
- Moving Averages (MA): The moving averages have been showing an upward trend, with the 5-day MA consistently rising above the longer-term SMAs and EMAs. This indicates a bullish trend in the short to medium term.
- MACD: The MACD line has been consistently above the signal line, with both lines trending upwards. The positive MACD histogram also supports the bullish momentum.
- Conclusion: The trend indicators suggest a strong bullish sentiment in the stock price movement.
Momentum Indicators:
- RSI: The RSI has been steadily increasing and is now in the overbought territory, indicating strong buying momentum.
- Stochastic Oscillator: Both %K and %D lines are in the overbought zone, suggesting a potential reversal or consolidation.
- Williams %R: The Williams %R is in the oversold region, indicating a potential reversal in the short term.
- Conclusion: The momentum indicators signal a mixed sentiment with potential for a short-term pullback or consolidation.
Volatility Indicators:
- Bollinger Bands (BB): The stock price has been consistently trading above the upper Bollinger Band, indicating overbought conditions and potential for a reversal or correction.
- Conclusion: The volatility indicators suggest a potential reversal or correction in the stock price due to overbought conditions.
Volume Indicators:
- On-Balance Volume (OBV): The OBV has been steadily increasing, indicating strong buying pressure and accumulation of the stock.
- Chaikin Money Flow (CMF): The CMF is positive, suggesting that money is flowing into the stock.
- Conclusion: The volume indicators support the bullish sentiment in the stock price movement.
Overall Conclusion:
Based on the analysis of trend, momentum, volatility, and volume indicators, the overall outlook for the next few days is as follows: - Trend: Upward trend with strong bullish momentum. - Momentum: Mixed sentiment with potential for a short-term pullback. - Volatility: Potential reversal or correction due to overbought conditions. - Volume: Bullish sentiment with strong buying pressure.
Final Recommendation:
Considering the overall analysis, it is likely that the stock price will experience a short-term pullback or correction before potentially resuming its upward trend. Traders should exercise caution and consider taking profits or implementing risk management strategies in anticipation of a temporary reversal in the stock price.