Technical Analysis of AACT 2024-05-31
Overview:
In analyzing the technical indicators for AACT stock over the last 5 days, we will delve into the trend, momentum, volatility, and volume indicators to provide a comprehensive outlook on the possible stock price movement in the coming days. By examining these key indicators, we aim to offer valuable insights and predictions for potential investors.
Trend Indicators:
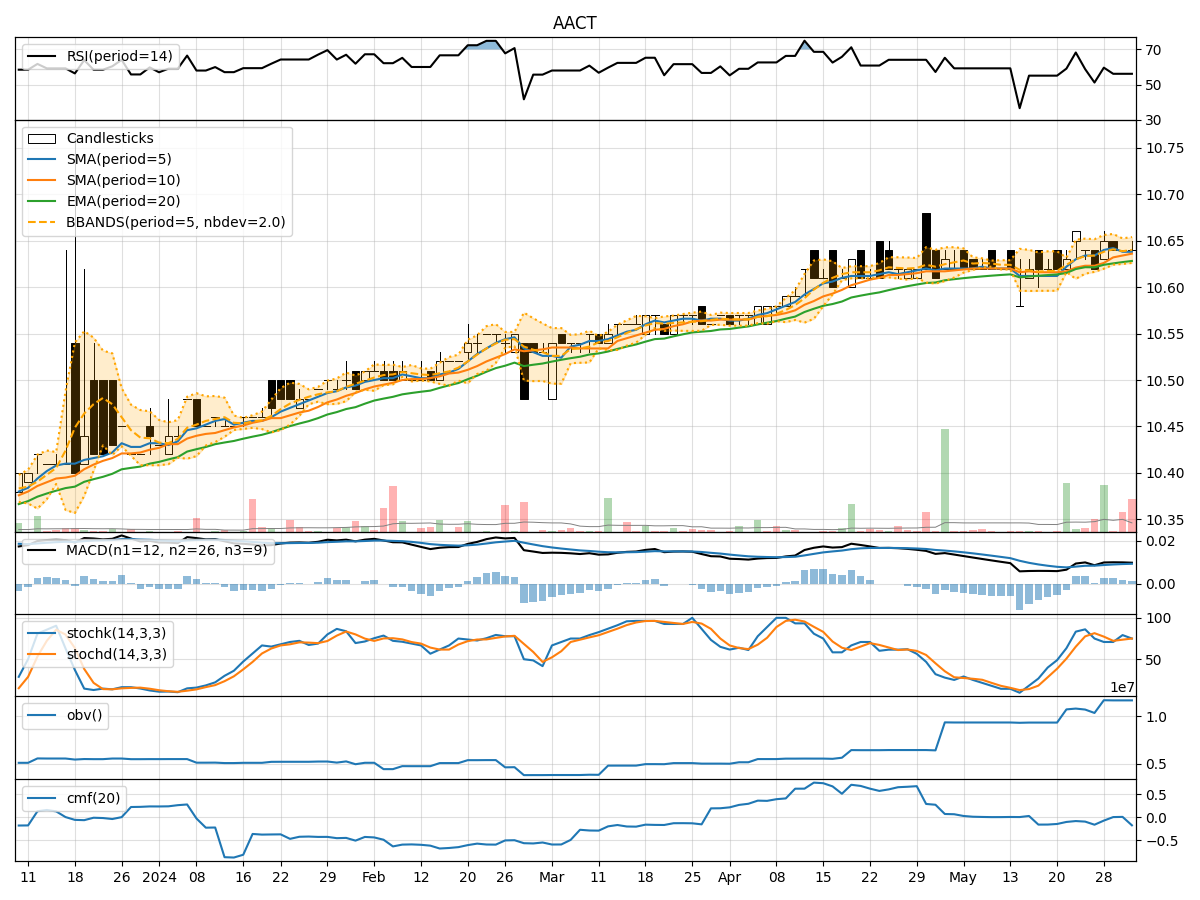
- Moving Averages (MA): The 5-day moving average has been relatively stable around $10.64, indicating a consistent trend in the stock price.
- MACD: The MACD line has shown a slight positive trend, with the MACD line consistently above the signal line, suggesting a bullish momentum.
- EMA: The exponential moving average has been gradually increasing, reflecting a positive price trend.
Momentum Indicators:
- RSI: The Relative Strength Index has been hovering around the neutral zone, indicating a balanced momentum in the stock.
- Stochastic Oscillator: The stochastic indicators have shown fluctuations but have not reached extreme levels, suggesting a moderate momentum in the stock.
- Williams %R: The Williams %R indicator has been oscillating near the oversold territory, indicating a potential reversal in the stock price.
Volatility Indicators:
- Bollinger Bands: The Bollinger Bands have shown narrowing bands, indicating decreasing volatility in the stock price.
- Bollinger %B: The %B indicator has been fluctuating within a range, suggesting a consolidation phase in the stock.
- Average True Range (ATR): The ATR has shown a decrease in volatility, indicating a potential stabilization in the stock price.
Volume Indicators:
- On-Balance Volume (OBV): The OBV indicator has remained relatively flat, suggesting a balance between buying and selling pressure.
- Chaikin Money Flow (CMF): The CMF has been fluctuating around the zero line, indicating a neutral money flow in the stock.
Conclusion:
Based on the analysis of the technical indicators, the stock of AACT is likely to experience sideways movement in the coming days. The stable moving averages, positive MACD trend, and decreasing volatility point towards a consolidation phase. The momentum indicators suggest a balanced momentum with potential for a reversal, while volume indicators indicate a neutral stance in terms of buying and selling pressure.
Key Conclusion: The stock is expected to trade within a narrow range in the near term, with a potential for a slight upward movement based on the positive trend indicators. Investors should closely monitor key support and resistance levels for potential breakout opportunities.