Technical Analysis of ACI 2024-05-10
Overview:
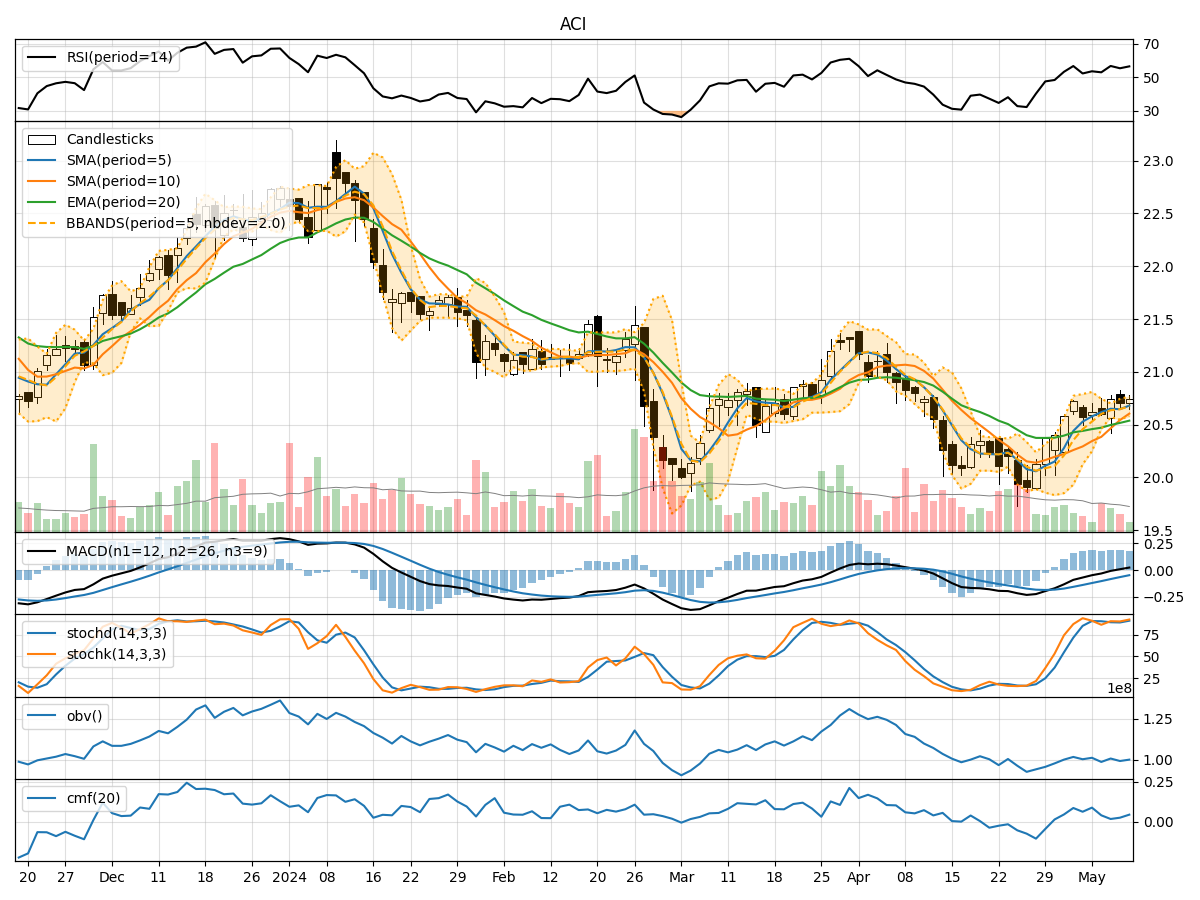
In analyzing the technical indicators for ACI over the last 5 days, we will delve into the trend, momentum, volatility, and volume indicators to provide a comprehensive outlook on the possible stock price movement in the coming days. By examining these key indicators, we aim to offer valuable insights and predictions for informed decision-making.
Trend Analysis:
- Moving Averages (MA): The 5-day Moving Average (MA) has been trending upwards, indicating a positive momentum in the stock price.
- MACD: The MACD line has been consistently above the signal line, suggesting a bullish trend in the short term.
- EMA: The Exponential Moving Average (EMA) has been steadily increasing, reflecting a positive price trend.
Momentum Analysis:
- RSI: The Relative Strength Index (RSI) has been hovering around the neutral zone, indicating a balanced momentum in the stock.
- Stochastic Oscillator: Both %K and %D values of the Stochastic Oscillator are in the overbought territory, signaling a potential reversal or consolidation.
Volatility Analysis:
- Bollinger Bands (BB): The stock price has been trading within the Bollinger Bands, with the bands slightly widening, suggesting increased volatility.
- Bollinger %B: The %B indicator is above 0.5, indicating a bullish sentiment in the market.
Volume Analysis:
- On-Balance Volume (OBV): The OBV has been fluctuating, indicating mixed buying and selling pressure in the stock.
- Chaikin Money Flow (CMF): The CMF has been positive, suggesting a net inflow of money into the stock.
Key Observations:
- The trend indicators point towards a bullish sentiment in the short term.
- Momentum indicators show a potential overbought condition, signaling a need for caution.
- Volatility indicators suggest an increase in price fluctuations.
- Volume indicators reflect mixed market participation.
Conclusion:
Based on the analysis of the technical indicators, the next few days' possible stock price movement for ACI is likely to be bullish in the short term. However, considering the overbought signals in the momentum indicators and the increased volatility, there might be a consolidation phase or a minor pullback before a potential continuation of the bullish trend. Traders and investors should closely monitor the price action and key support/resistance levels for timely decision-making.