Technical Analysis of ACM 2024-05-10
Overview:
In analyzing the technical indicators for ACM over the last 5 days, we will delve into the trend, momentum, volatility, and volume indicators to provide a comprehensive outlook on the possible stock price movement in the coming days. By examining these key indicators, we aim to offer valuable insights and predictions to guide your investment decisions.
Trend Analysis:
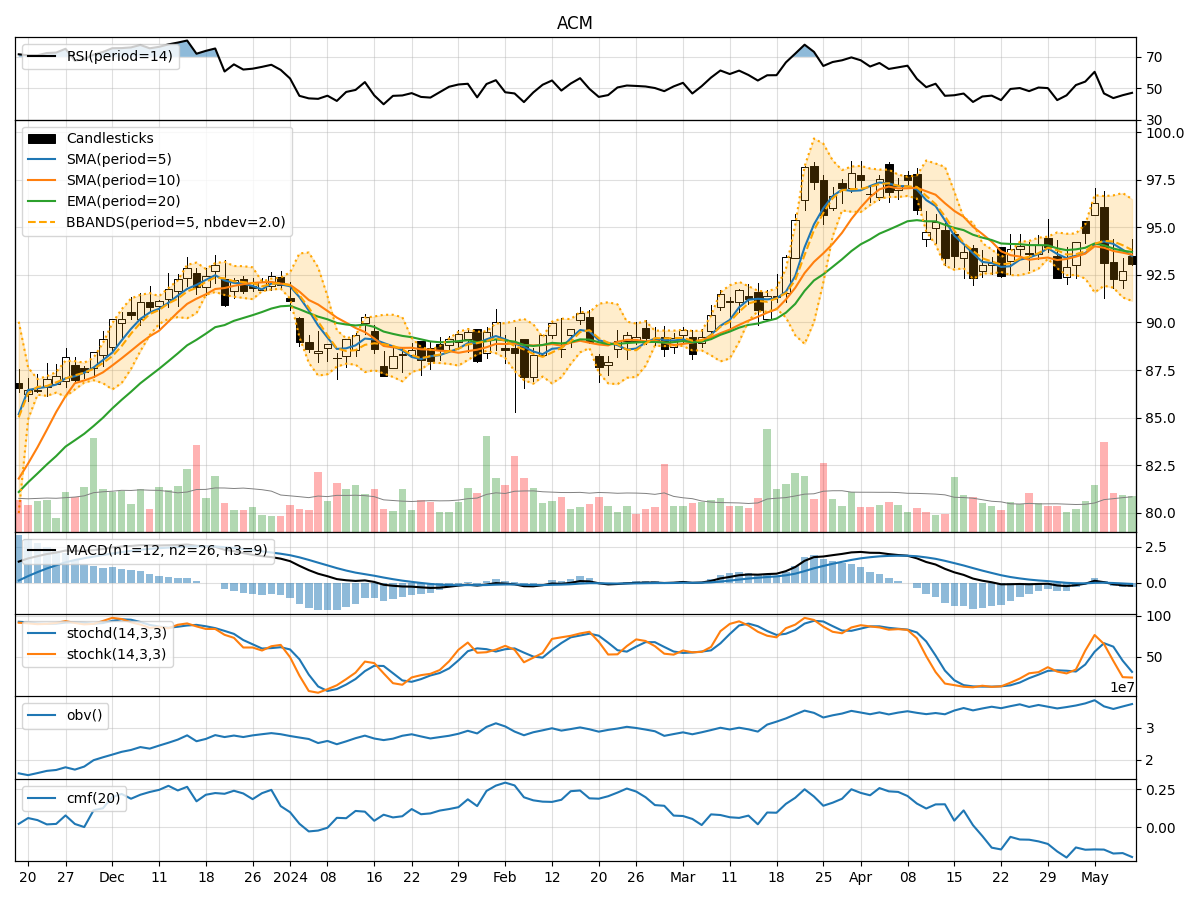
- Moving Averages (MA): The 5-day Moving Average (MA) has been declining gradually from 94.102 to 93.490, indicating a short-term bearish trend.
- MACD: The Moving Average Convergence Divergence (MACD) has been consistently negative, with the MACD line below the signal line, suggesting a bearish momentum.
- EMA: The Exponential Moving Average (EMA) has also been trending downwards, further supporting the bearish sentiment.
Momentum Analysis:
- RSI: The Relative Strength Index (RSI) has been hovering around the neutral zone, indicating a lack of strong momentum in either direction.
- Stochastic Oscillator: Both %K and %D of the Stochastic Oscillator are in the oversold territory, suggesting a potential reversal or consolidation.
- Williams %R: The Williams %R is also in the oversold region, signaling a possible buying opportunity.
Volatility Analysis:
- Bollinger Bands: The Bollinger Bands are narrowing, indicating decreasing volatility and a potential period of consolidation.
- Bollinger %B: The %B indicator is below 0.5, suggesting the stock is trading below the lower Bollinger Band, potentially oversold.
Volume Analysis:
- On-Balance Volume (OBV): The OBV has been fluctuating, indicating indecision among investors regarding the stock.
- Chaikin Money Flow (CMF): The CMF is negative, reflecting selling pressure in the stock.
Key Observations:
- The stock is currently in a short-term bearish trend based on moving averages and MACD.
- Momentum indicators suggest a possible reversal or consolidation in the near term.
- Volatility is decreasing, indicating a potential period of consolidation.
- Volume indicators show mixed signals, with no clear direction in investor sentiment.
Conclusion:
Based on the analysis of the technical indicators, the next few days for ACM could see sideways movement or a slight consolidation as the stock appears to be in a short-term bearish phase but also shows signs of potential reversal or stabilization. Investors should closely monitor key support and resistance levels for any potential breakout or trend reversal. It is advisable to exercise caution and wait for clearer signals before making significant trading decisions.