Technical Analysis of ACN 2024-05-10
Overview:
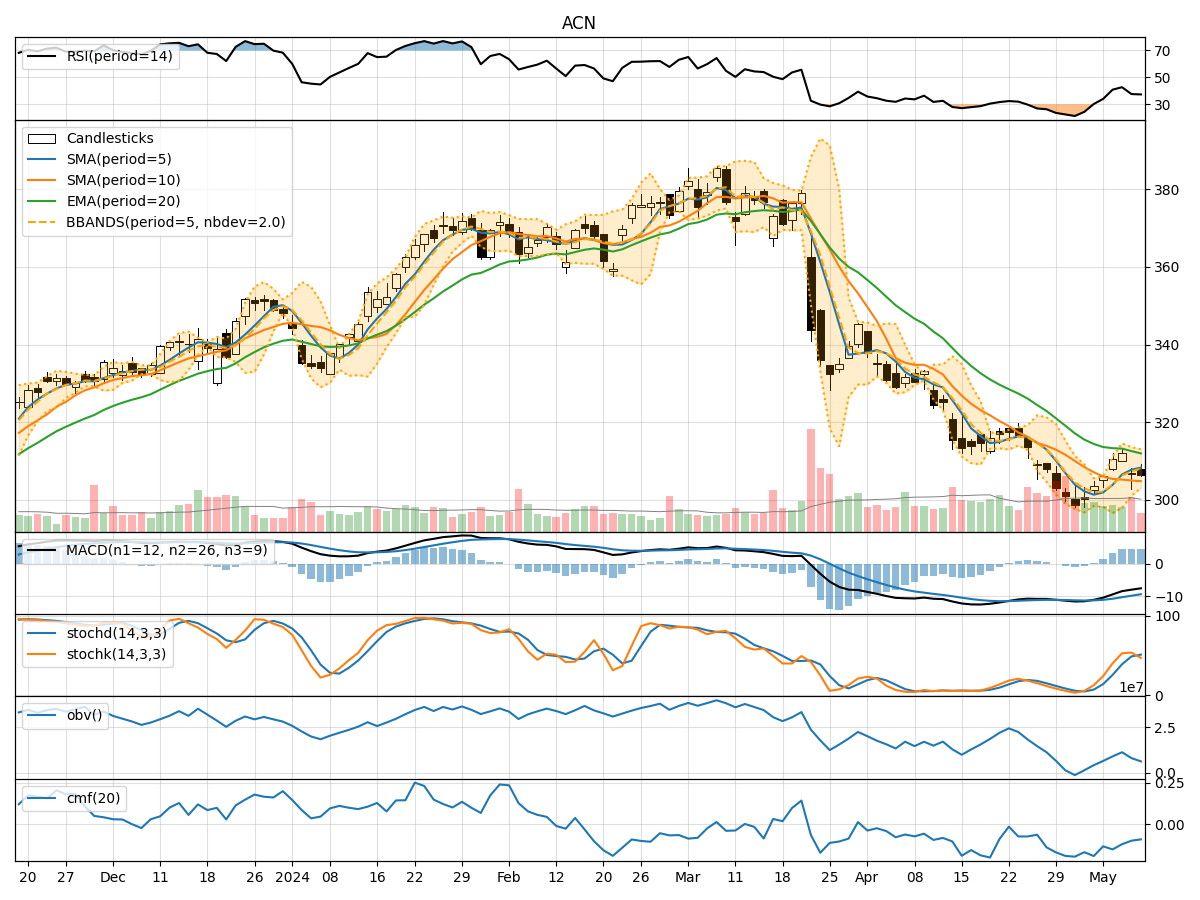
In the last 5 trading days, ACN stock has shown mixed signals across various technical indicators. The trend indicators suggest a slight bullish sentiment, with the moving averages trending upwards. Momentum indicators show a neutral to slightly bearish outlook, while volatility indicators indicate a decreasing level of volatility. Volume indicators also show a decrease in buying pressure.
Trend Indicators:
- Moving Averages (MA): The 5-day MA is above the 10-day SMA, indicating a short-term bullish trend. However, the EMA(20) is slightly above the current price, suggesting a potential resistance level.
- MACD: The MACD line is negative but trending upwards, while the MACD Histogram is also showing signs of improvement. This could indicate a potential bullish crossover in the near future.
Momentum Indicators:
- RSI: The RSI is below 50, indicating a bearish momentum. However, it is not in oversold territory, suggesting a neutral stance.
- Stochastic Oscillator: The Stochastics are in the neutral zone, not indicating any extreme overbought or oversold conditions. This suggests a lack of strong momentum in either direction.
Volatility Indicators:
- Bollinger Bands: The Bollinger Bands are narrowing, indicating decreasing volatility. This could suggest a period of consolidation or a potential breakout in the near future.
Volume Indicators:
- On-Balance Volume (OBV): The OBV is showing a decrease in volume, indicating a lack of strong buying pressure. This could potentially lead to a lack of momentum in the stock price movement.
- Chaikin Money Flow (CMF): The CMF is negative, indicating a bearish money flow. This suggests that selling pressure may be dominant in the market currently.
Key Observations and Opinions:
- Trend: The trend indicators suggest a slightly bullish sentiment, but the resistance at the EMA(20) could pose a challenge for further upside movement.
- Momentum: The momentum indicators show a lack of strong directional momentum, indicating a neutral to slightly bearish outlook.
- Volatility: Decreasing volatility could lead to a period of consolidation or a potential breakout, depending on external market factors.
- Volume: The decrease in buying pressure indicated by volume indicators could limit the stock's upward potential in the short term.
Conclusion:
Based on the analysis of the technical indicators, the next few days for ACN stock could see sideways movement or consolidation. The lack of strong bullish momentum, coupled with decreasing volatility and buying pressure, suggests that the stock may struggle to make significant upward moves. Traders and investors should closely monitor the EMA(20) resistance level and watch for any potential breakout or breakdown from the current trading range. It is advisable to wait for clearer signals before making any significant trading decisions.