Technical Analysis of ADC 2024-05-10
Overview:
In analyzing the technical indicators for ADC over the last 5 days, we will delve into the trend, momentum, volatility, and volume indicators to provide a comprehensive outlook on the possible stock price movement in the coming days. By examining these key indicators, we aim to offer valuable insights and predictions for informed decision-making.
Trend Analysis:
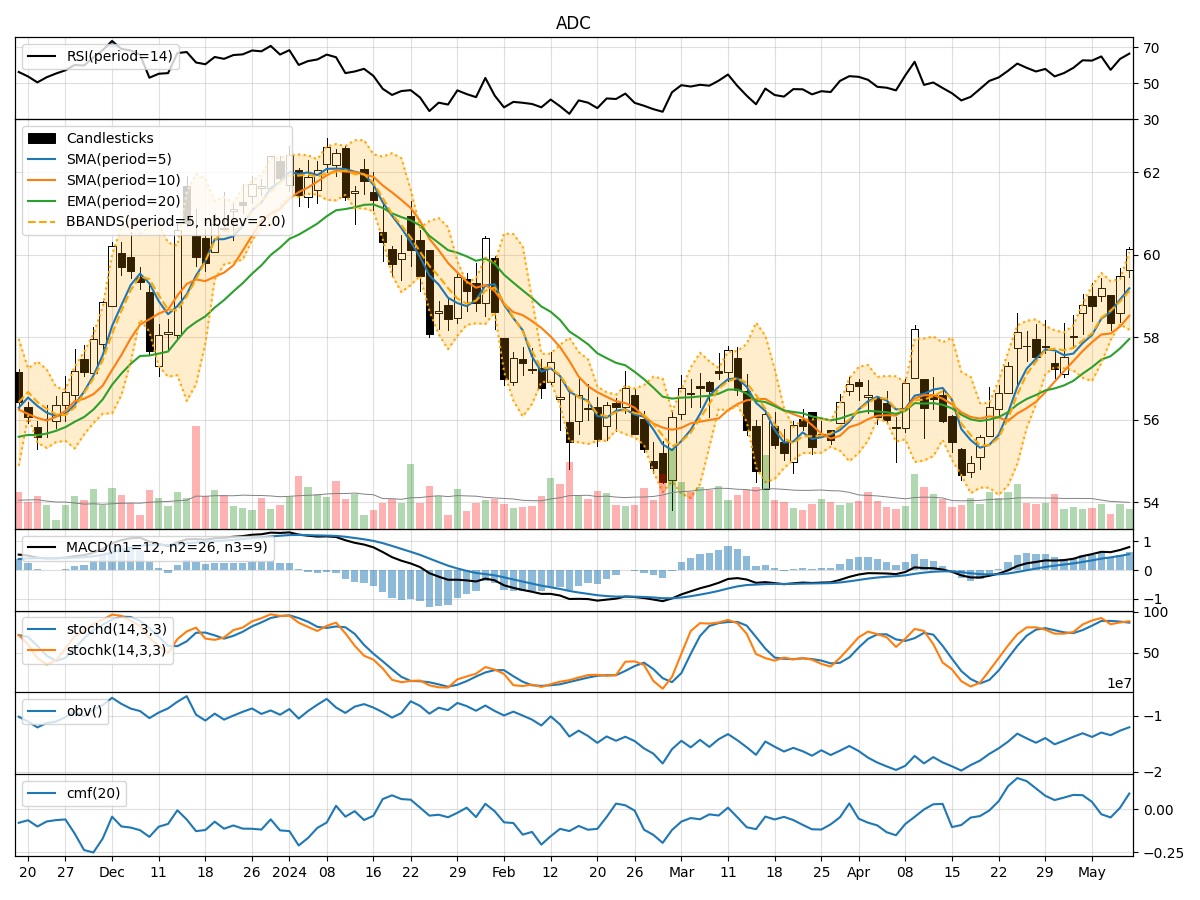
- Moving Averages (MA): The 5-day Moving Average (MA) has been consistently trending upwards, indicating a positive momentum in the stock price.
- MACD: The MACD line has been above the signal line for the past 5 days, suggesting a bullish trend.
- EMA: The Exponential Moving Average (EMA) has also been on an upward trajectory, supporting the bullish sentiment in the short to medium term.
Momentum Analysis:
- RSI: The Relative Strength Index (RSI) has been fluctuating but generally staying within the neutral to overbought territory, reflecting a mixed sentiment among traders.
- Stochastic Oscillator: Both %K and %D have been relatively high, indicating a strong bullish momentum.
- Williams %R: The Williams %R has been hovering around oversold levels, suggesting a potential reversal in the short term.
Volatility Analysis:
- Bollinger Bands: The Bollinger Bands have been widening, indicating increased volatility in the stock price.
- Bollinger %B: The %B indicator has been fluctuating within a range, suggesting potential price reversals or breakouts.
Volume Analysis:
- On-Balance Volume (OBV): The OBV has been fluctuating, indicating mixed buying and selling pressure.
- Chaikin Money Flow (CMF): The CMF has been mostly negative, signaling a slight bearish sentiment in the market.
Key Observations:
- The trend indicators suggest a bullish outlook in the short to medium term.
- Momentum indicators show a strong bullish momentum but with some signs of potential reversal.
- Volatility indicators point to increased price fluctuations and potential breakouts.
- Volume indicators reflect mixed buying and selling pressure, with a slight bearish sentiment.
Conclusion:
Based on the analysis of the technical indicators, the overall outlook for ADC in the next few days is bullish. The stock is likely to continue its upward trend, supported by positive moving averages, MACD signals, and strong momentum indicators. However, traders should remain cautious of potential reversals indicated by overbought conditions in some momentum indicators and increased volatility. It is advisable to closely monitor key support and resistance levels for timely decision-making.