Technical Analysis of ADT 2024-05-10
Overview:
In analyzing the technical indicators for ADT over the last 5 days, we will delve into the trend, momentum, volatility, and volume indicators to provide a comprehensive outlook on the possible stock price movement. By examining these key aspects, we aim to offer valuable insights and predictions for the upcoming days.
Trend Indicators:
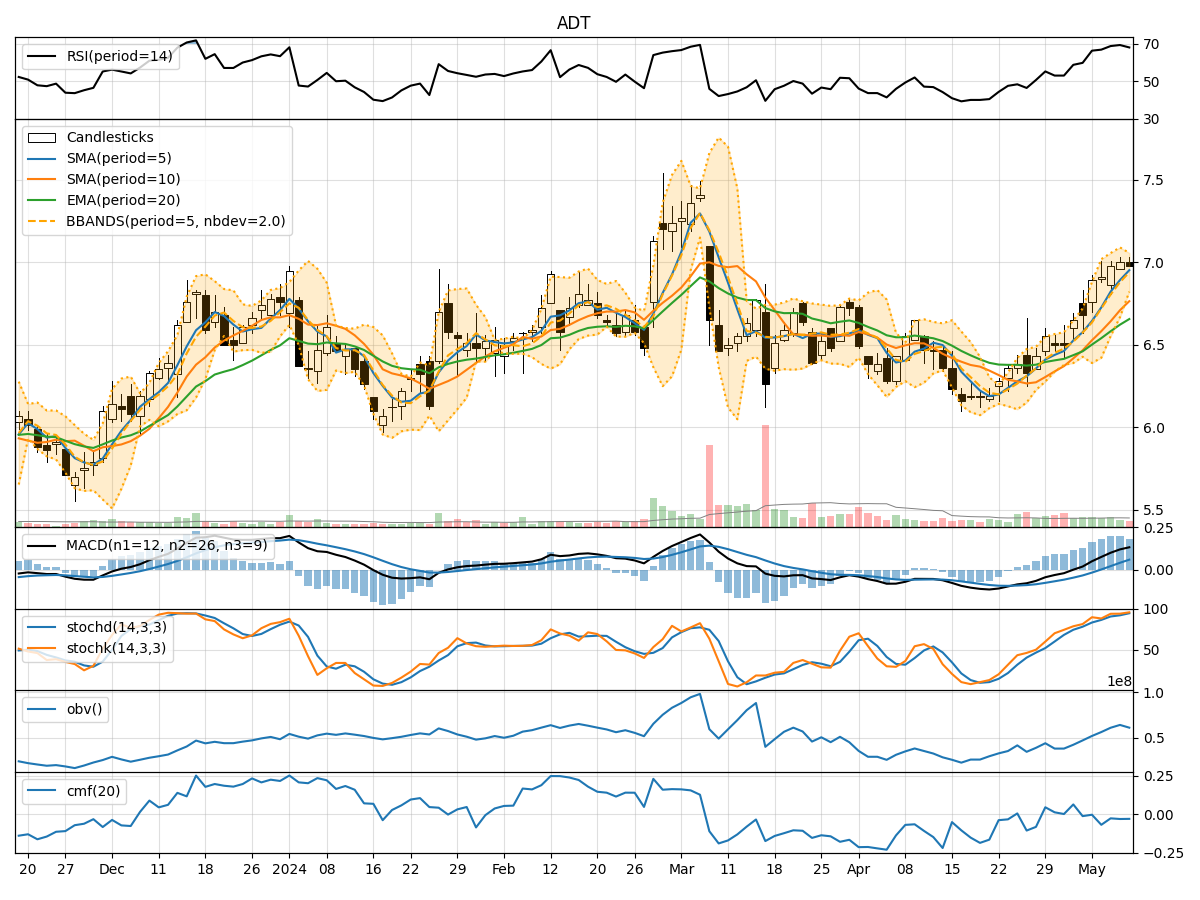
- Moving Averages (MA): The 5-day Moving Average has been consistently above the closing prices, indicating a bullish trend.
- MACD: The MACD line has been above the signal line, suggesting a positive momentum in the stock price.
- EMA: The Exponential Moving Average has been trending upwards, reflecting a bullish sentiment in the market.
Momentum Indicators:
- RSI: The Relative Strength Index has been in the overbought territory, indicating a strong bullish momentum.
- Stochastic Oscillator: Both %K and %D have been in the overbought zone, signaling a potential reversal or consolidation.
- Williams %R: The indicator has been in the oversold region, suggesting a possible reversal in the stock price.
Volatility Indicators:
- Bollinger Bands: The bands have been narrowing, indicating decreasing volatility and a potential breakout in the near future.
- Bollinger %B: The %B indicator has been decreasing, suggesting a possible consolidation phase.
Volume Indicators:
- On-Balance Volume (OBV): The OBV has shown mixed signals, with fluctuations in volume accumulation.
- Chaikin Money Flow (CMF): The CMF has been negative, indicating selling pressure in the stock.
Key Observations and Opinions:
- Trend: The stock is in an upward trend based on moving averages and MACD.
- Momentum: The momentum indicators suggest a strong bullish sentiment but also hint at potential overbought conditions.
- Volatility: Volatility is decreasing, indicating a possible period of consolidation.
- Volume: Volume indicators show mixed signals, with no clear direction in volume accumulation.
Conclusion:
Based on the analysis of technical indicators, the next few days for ADT stock price movement could see a consolidation phase or a potential reversal from the overbought levels indicated by momentum indicators. Traders should closely monitor the narrowing Bollinger Bands for a breakout signal and watch for any shifts in volume accumulation to confirm the direction of the stock price. Overall, a cautious approach is recommended, considering the mixed signals from volume indicators and the possibility of a short-term correction in the stock price.