Technical Analysis of AEE 2024-05-10
Overview:
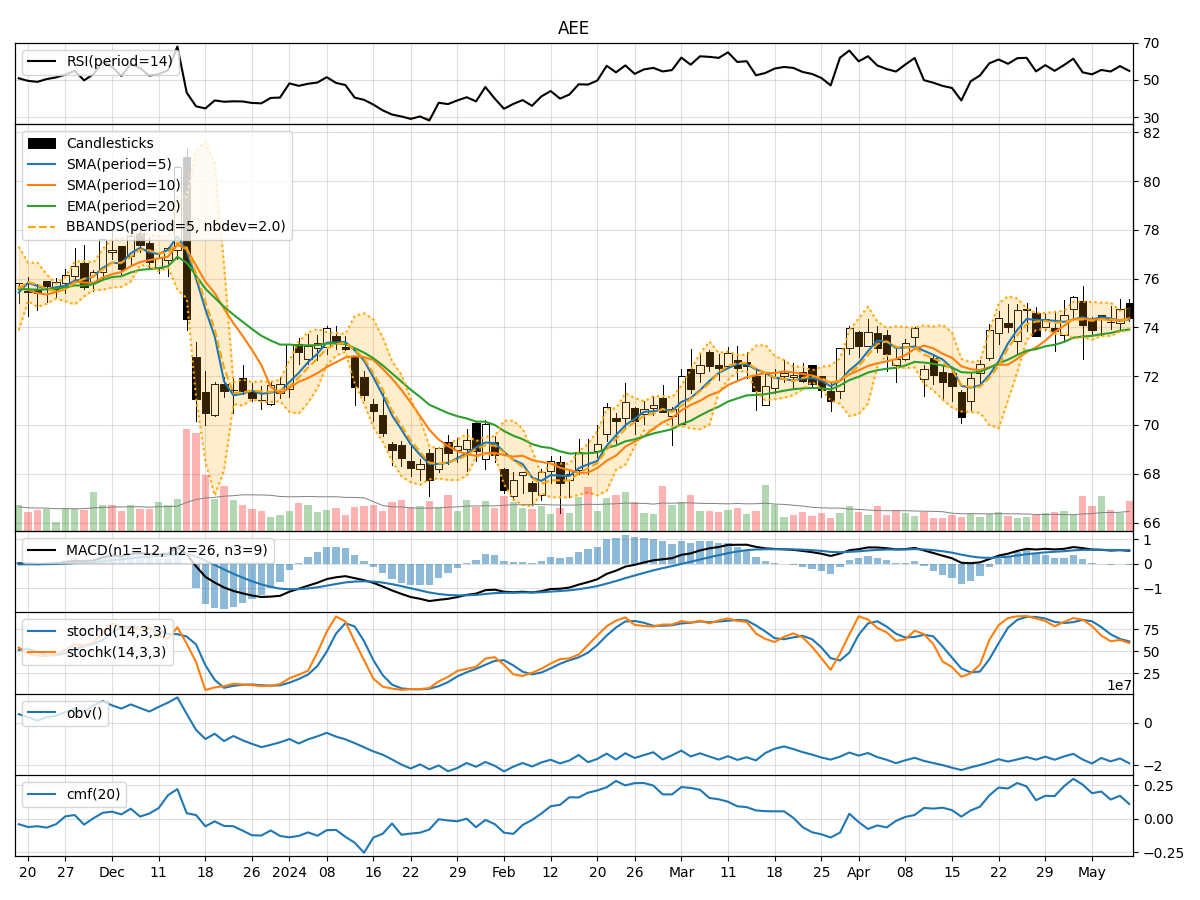
In analyzing the technical indicators for AEE over the last 5 days, we will delve into the trend, momentum, volatility, and volume indicators to provide a comprehensive outlook on the possible stock price movement. By examining these key aspects, we aim to offer valuable insights and predictions for the upcoming days.
Trend Analysis:
- Moving Averages (MA): The 5-day Moving Average (MA) has been relatively stable around the $74 range, indicating a neutral trend.
- MACD: The MACD line has been hovering around 0, suggesting a balanced momentum in the short term.
- EMA: The Exponential Moving Average (EMA) has shown a slight upward trend, indicating a potential bullish sentiment.
Momentum Analysis:
- RSI: The Relative Strength Index (RSI) has been fluctuating around the mid-level, indicating a lack of strong momentum.
- Stochastic Oscillator: Both %K and %D have been declining, signaling a potential bearish momentum.
- Williams %R: The Williams %R is in the oversold territory, suggesting a possible reversal in the short term.
Volatility Analysis:
- Bollinger Bands (BB): The Bollinger Bands have been narrowing, indicating decreasing volatility in the stock price.
- BB %B: The %B indicator is below 0.5, suggesting a potential buying opportunity as the stock may be oversold.
Volume Analysis:
- On-Balance Volume (OBV): The OBV has shown mixed signals, with no clear trend in volume accumulation.
- Chaikin Money Flow (CMF): The CMF has been relatively stable, indicating a neutral sentiment towards the stock.
Key Observations:
- The stock is currently trading within a tight range, with limited volatility and mixed momentum signals.
- The moving averages suggest a neutral trend, while the MACD and EMA indicate a potential bullish bias.
- The stochastic oscillator and Williams %R point towards a bearish momentum, while the RSI reflects a lack of strong conviction in either direction.
Conclusion:
Based on the analysis of the technical indicators, the stock price of AEE is likely to experience sideways consolidation in the upcoming days. While there are indications of a potential bullish bias from the MACD and EMA, the bearish signals from the stochastic oscillator and Williams %R could limit significant upward movements. Traders may consider cautious trading strategies in anticipation of a breakout from the current consolidation phase.