Technical Analysis of AEM 2024-05-10
Overview:
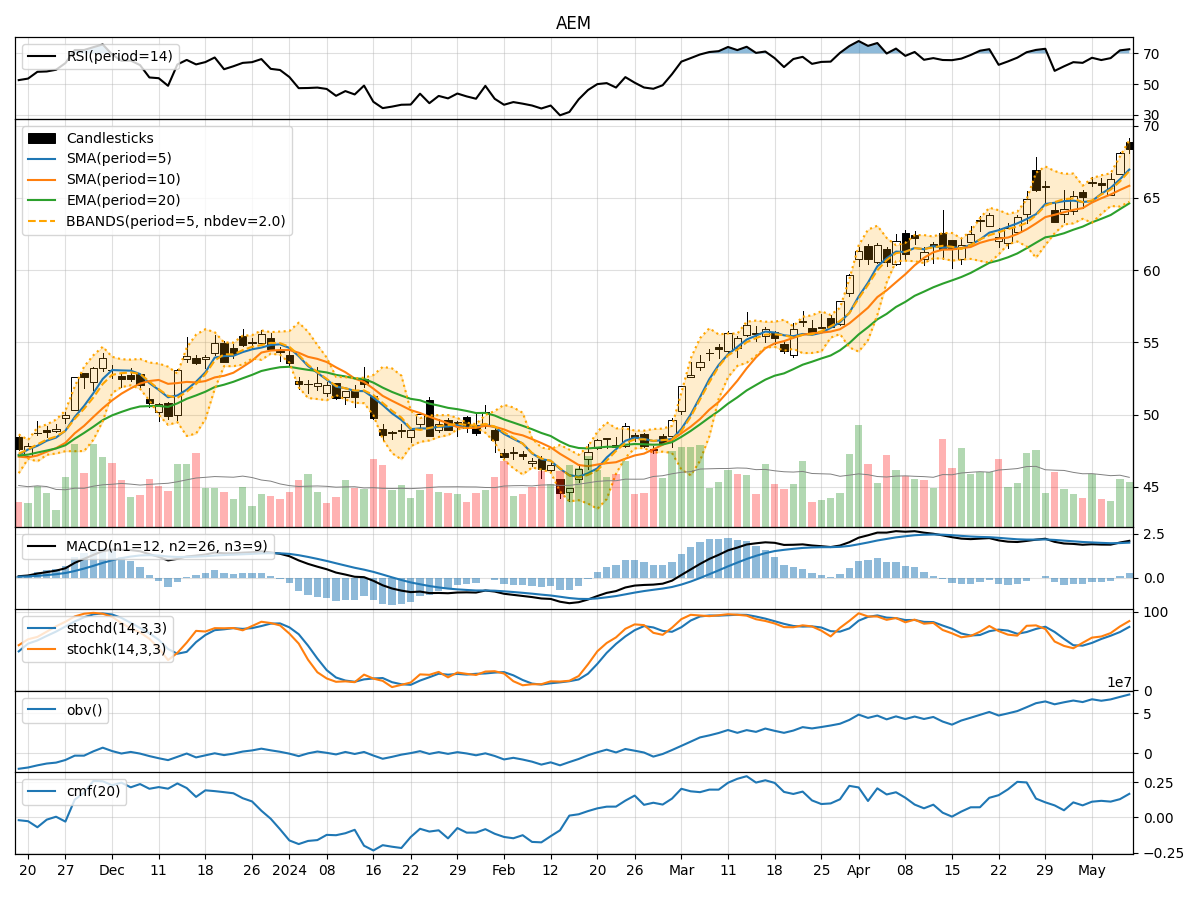
In the last 5 trading days, AEM stock has shown a consistent uptrend in both price and volume. The moving averages have been trending upwards, indicating a bullish sentiment. Momentum indicators like RSI and Stochastic oscillators suggest the stock is in overbought territory but still have room for further upside. Volatility indicators show a widening of Bollinger Bands, indicating increased price volatility. Volume indicators like OBV and CMF confirm the buying pressure.
Trend Analysis:
- Moving Averages (MA): The 5-day MA has been consistently above the longer-term SMAs, indicating a strong bullish trend.
- MACD: The MACD line has been above the signal line, showing positive momentum.
Momentum Analysis:
- RSI: The RSI is in overbought territory, suggesting a potential pullback or consolidation.
- Stochastic Oscillator: Both %K and %D are in the overbought zone, indicating a possible reversal.
Volatility Analysis:
- Bollinger Bands (BB): The widening of the bands suggests increasing volatility and potential price swings.
Volume Analysis:
- On-Balance Volume (OBV): The OBV has been steadily increasing, indicating strong buying pressure.
- Chaikin Money Flow (CMF): The CMF is positive, reflecting accumulation by investors.
Key Observations:
- The stock is currently in a strong uptrend, supported by moving averages and MACD.
- Momentum indicators suggest a potential overbought scenario, signaling a need for caution.
- Volatility is increasing, which could lead to larger price movements.
- Volume indicators confirm the bullish trend with increasing buying pressure.
Conclusion:
Based on the technical analysis of AEM stock: - Short-Term: The stock may experience a slight pullback or consolidation due to overbought conditions indicated by momentum indicators. - Medium-Term: The overall trend remains bullish, and any pullback could present a buying opportunity for investors. - Long-Term: The stock is likely to continue its upward trajectory, supported by strong volume and positive trend indicators.
Recommendation:
- Upcoming Days: Expect a short-term correction or consolidation before a potential resumption of the uptrend.
- Investment Strategy: Consider buying on dips or holding existing positions for further upside potential.
- Risk Management: Keep an eye on momentum indicators for signs of a trend reversal and set stop-loss levels accordingly.
Key Words:
- Bullish: Overall trend is positive.
- Consolidation: Short-term sideways movement expected.
- Caution: Momentum indicators signal potential overbought conditions.
- Buy on Dips: Consider accumulating during pullbacks for long-term gains.