Technical Analysis of AER 2024-05-10
Overview:
In analyzing the technical indicators for AER over the last 5 days, we will delve into the trend, momentum, volatility, and volume indicators to provide a comprehensive outlook on the possible stock price movement. By examining these key factors, we aim to offer valuable insights and predictions for the upcoming trading days.
Trend Analysis:
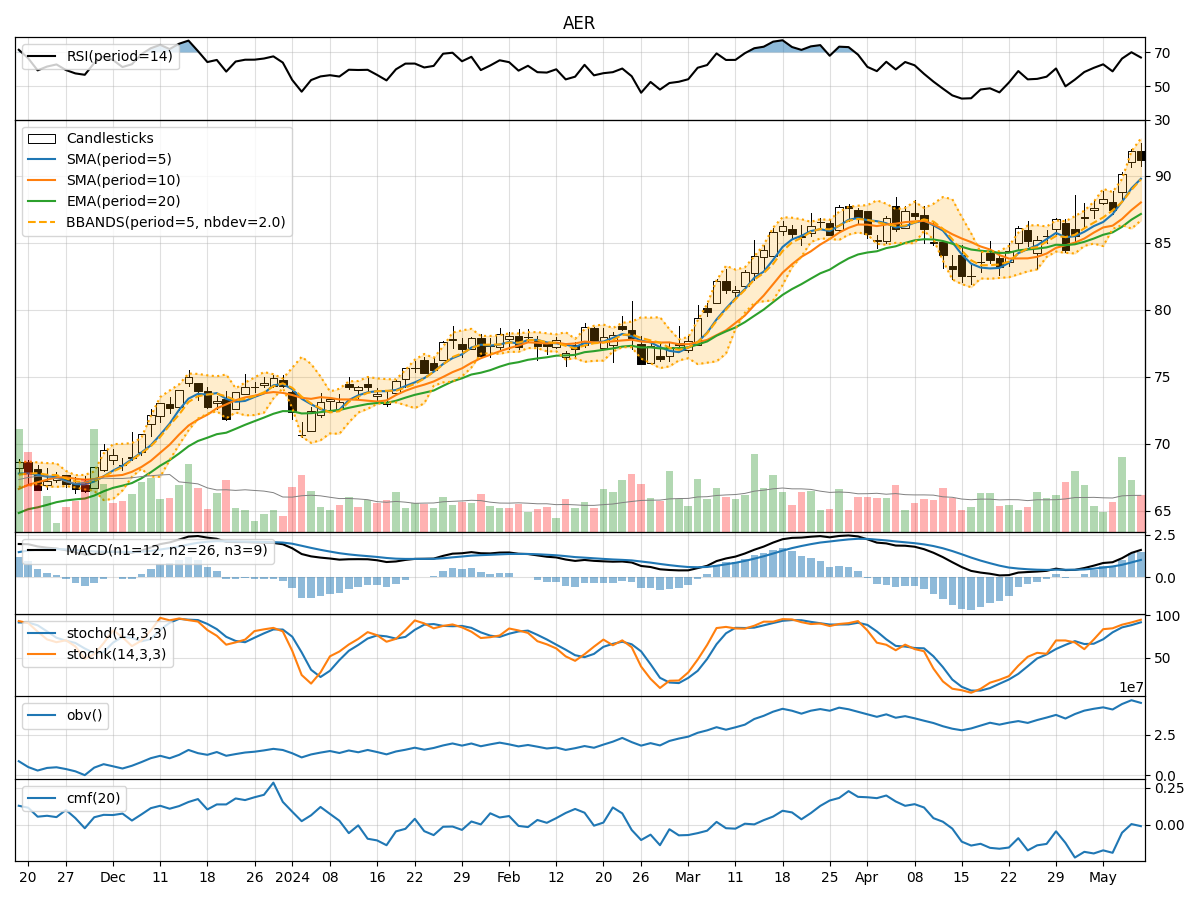
- Moving Averages (MA): The moving averages show a consistent uptrend over the last 5 days, with the 5-day MA consistently above the 10-day SMA and 20-day EMA. This indicates a bullish trend in the short term.
- MACD: The MACD line has been consistently above the signal line, with both lines showing an upward trajectory. The MACD histogram has also been increasing, indicating strengthening bullish momentum.
Momentum Analysis:
- RSI: The RSI has been fluctuating but generally staying above the 50 level, indicating bullish momentum. However, it is important to note that it is not in overbought territory, suggesting room for further upside.
- Stochastic Oscillator: Both %K and %D lines of the Stochastic Oscillator have been in the overbought zone, suggesting a strong bullish momentum. However, caution is advised as the stock may be due for a pullback.
Volatility Analysis:
- Bollinger Bands (BB): The stock price has been trading within the upper Bollinger Band, indicating an overbought condition. This could suggest a potential reversal or consolidation in the near term.
- Bollinger %B: The %B indicator has been above 0.8, indicating that the stock is trading at the upper end of its recent price range. This could signal a period of consolidation or a potential pullback.
Volume Analysis:
- On-Balance Volume (OBV): The OBV has been fluctuating but has not shown a clear trend, suggesting indecision among market participants regarding the stock.
- Chaikin Money Flow (CMF): The CMF has been negative over the last 5 days, indicating that money may be flowing out of the stock. This could be a bearish signal for the stock price.
Conclusion:
Based on the analysis of the technical indicators, the stock of AER is currently in an overbought condition as indicated by the high RSI, Stochastic Oscillator in the overbought zone, and trading near the upper Bollinger Band. While the trend indicators suggest a bullish outlook, the momentum indicators and volatility indicators point towards a potential reversal or consolidation in the near term. The volume indicators also indicate indecisiveness among market participants.
Therefore, considering all the factors, it is likely that AER may experience a short-term pullback or consolidation in the upcoming trading days. Traders and investors should exercise caution and consider potential profit-taking opportunities or wait for a clearer trend confirmation before making any significant trading decisions.