Technical Analysis of AFG 2024-05-10
Overview:
In analyzing the technical indicators for AFG stock over the last 5 days, we will delve into the trend, momentum, volatility, and volume indicators to provide a comprehensive outlook on the possible stock price movement in the coming days. By examining these key indicators, we aim to offer valuable insights and predictions for potential investors.
Trend Indicators:
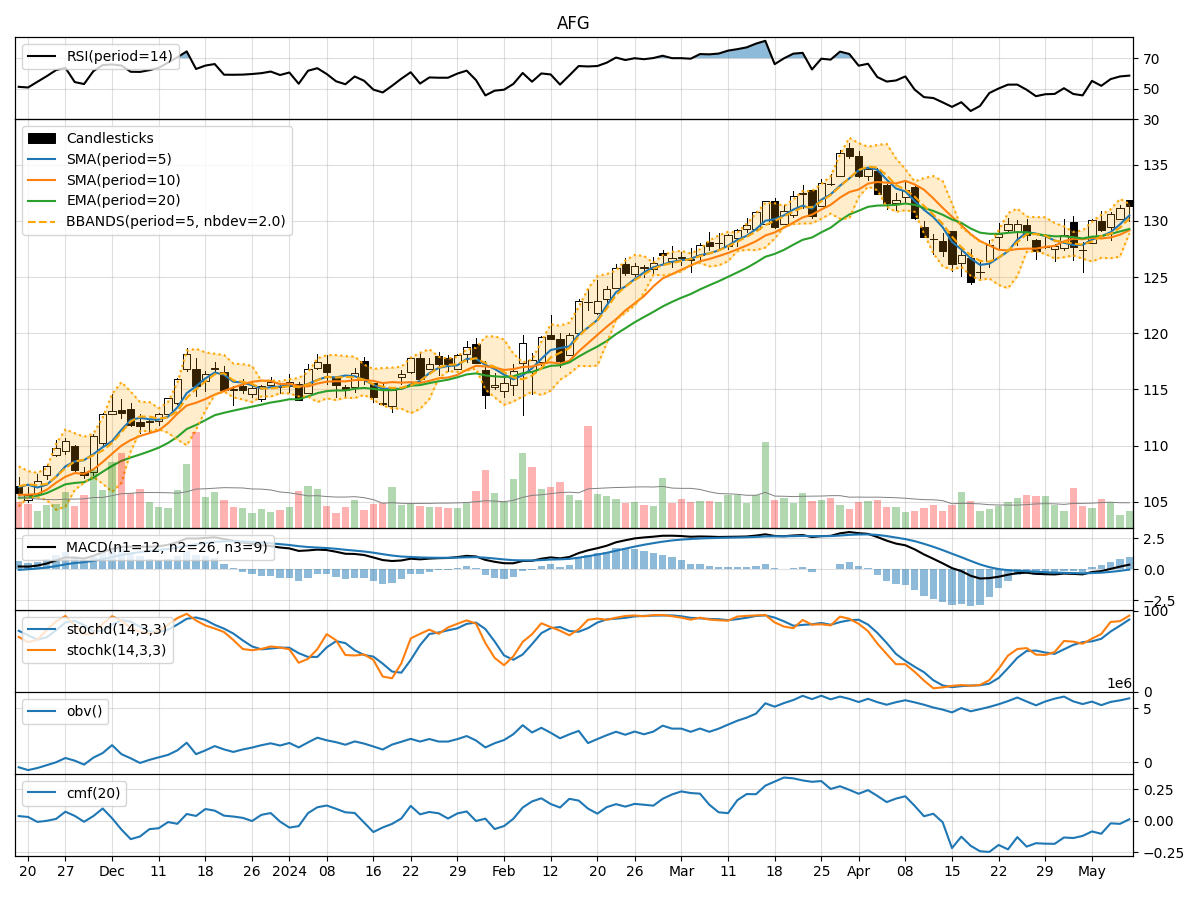
- Moving Averages (MA): The moving averages have been showing an upward trend over the last 5 days, with the 5-day MA consistently above the longer-term SMAs and EMAs. This indicates a positive momentum in the stock price.
- MACD: The MACD line has been consistently above the signal line, suggesting a bullish trend in the stock price.
- MACD Histogram: The MACD histogram has been increasing, indicating a strengthening bullish momentum.
Momentum Indicators:
- RSI: The RSI has been hovering around the neutral level, indicating a balanced momentum in the stock price.
- Stochastic Oscillator: Both %K and %D lines of the stochastic oscillator have been in the overbought territory, suggesting a potential reversal or consolidation in the stock price.
- Williams %R: The Williams %R is currently in the oversold region, indicating a possible buying opportunity.
Volatility Indicators:
- Bollinger Bands: The Bollinger Bands have been widening, indicating an increase in volatility in the stock price.
- Bollinger %B: The %B indicator is below 1, suggesting that the stock price is trading below the lower Bollinger Band, potentially indicating an oversold condition.
Volume Indicators:
- On-Balance Volume (OBV): The OBV indicator has been fluctuating, indicating a mixed sentiment among investors regarding the stock.
- Chaikin Money Flow (CMF): The CMF has been negative, suggesting that money is flowing out of the stock.
Conclusion:
Based on the analysis of the technical indicators, the stock of AFG is currently exhibiting a bullish trend in the short term, supported by the moving averages and MACD indicators. However, the momentum indicators such as the stochastic oscillator and Williams %R suggest a potential reversal or consolidation in the stock price due to overbought conditions. The volatility indicators point towards an increase in volatility, which could lead to sharp price movements.
Considering the mixed signals from the volume indicators, it is essential for investors to closely monitor the stock price movement in the coming days. In conclusion, while the short-term outlook appears bullish, caution is advised due to the potential for a reversal or consolidation in the near future. Investors should set appropriate stop-loss levels and closely follow the key technical levels to make informed trading decisions.