Technical Analysis of AGI 2024-05-10
Overview:
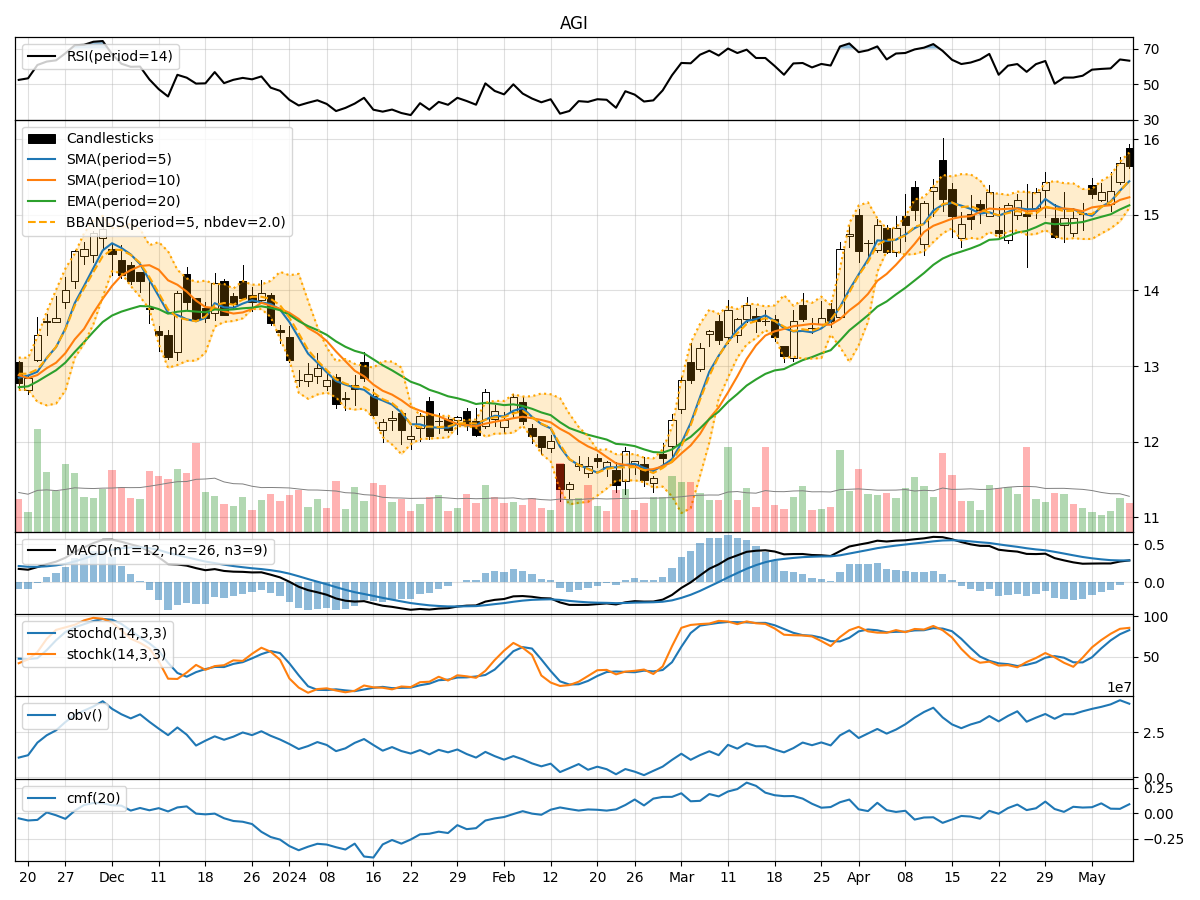
In the last 5 trading days, AGI stock has shown a consistent uptrend in its price, supported by increasing volumes. The moving averages have been trending upwards, indicating a positive momentum. The MACD and RSI also suggest bullish sentiment. However, the stock is currently trading near its upper Bollinger Band, indicating potential overbought conditions. Let's delve deeper into each category of technical indicators to provide a comprehensive analysis and make a prediction for the next few days.
Trend Indicators:
- Moving Averages (MA): The 5-day MA has been consistently above the 10-day SMA, indicating a short-term bullish trend. The EMA(20) is also trending upwards, supporting the bullish momentum.
- MACD: The MACD line has been above the signal line for the past few days, indicating a bullish trend. However, the MACD histogram has been decreasing, suggesting a potential slowdown in the uptrend.
Momentum Indicators:
- RSI: The RSI has been in the overbought territory but has not shown any signs of divergence yet. This indicates strong buying momentum in the stock.
- Stochastic Oscillator: Both %K and %D lines are in the overbought zone, suggesting that the stock may be overvalued in the short term.
Volatility Indicators:
- Bollinger Bands (BB): The stock is currently trading near the upper Bollinger Band, indicating that it may be overextended. This could lead to a potential pullback or consolidation in the near future.
- Bollinger %B (BBP): The %B is above 0.8, indicating that the stock is trading at the upper end of its recent price range.
Volume Indicators:
- On-Balance Volume (OBV): The OBV has been steadily increasing over the past few days, indicating strong buying pressure in the stock.
- Chaikin Money Flow (CMF): The CMF(20) is positive, suggesting that money is flowing into the stock. However, the recent decrease in CMF value indicates a slight decrease in buying pressure.
Conclusion:
Based on the analysis of the technical indicators, the stock is currently in overbought territory and trading near its upper Bollinger Band. While the trend and momentum indicators suggest a bullish outlook, the overbought conditions and potential for a pullback indicated by the volatility indicators should not be ignored. Therefore, in the next few days, we may see a consolidation or a slight pullback in the stock price as it corrects from its overbought levels. Traders should exercise caution and consider taking profits or waiting for a better entry point before initiating new long positions.