Technical Analysis of AGO 2024-05-10
Overview:
In analyzing the technical indicators for AGO over the last 5 days, we will delve into the trend, momentum, volatility, and volume indicators to provide a comprehensive outlook on the possible stock price movement in the coming days. By examining these key indicators, we aim to offer valuable insights and predictions for informed decision-making.
Trend Analysis:
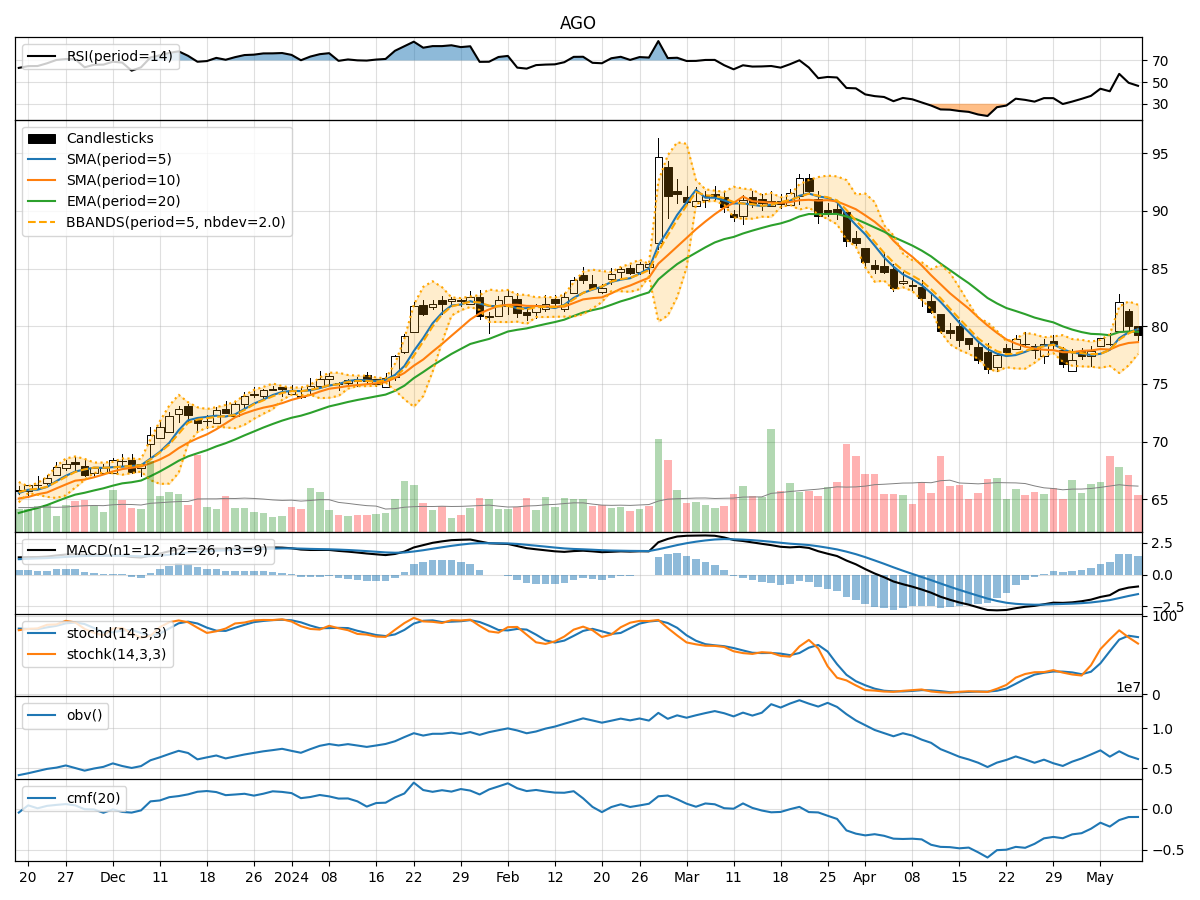
- Moving Averages (MA): The 5-day Moving Average (MA) has been fluctuating around the closing prices, indicating short-term price trends. The Simple Moving Average (SMA) and Exponential Moving Average (EMA) suggest a potential uptrend.
- MACD: The Moving Average Convergence Divergence (MACD) shows a positive trend, with the MACD line consistently above the signal line, indicating bullish momentum.
Momentum Analysis:
- RSI: The Relative Strength Index (RSI) has been oscillating around the mid-level, suggesting a balanced momentum between buying and selling pressure.
- Stochastic Oscillator: The Stochastic indicators show a mix of overbought and oversold conditions, indicating potential reversals in price direction.
Volatility Analysis:
- Bollinger Bands (BB): The Bollinger Bands are narrowing, indicating decreasing volatility and a potential consolidation phase.
Volume Analysis:
- On-Balance Volume (OBV): The OBV has been fluctuating, suggesting indecision among investors regarding the stock's direction.
- Chaikin Money Flow (CMF): The CMF is negative, indicating outflow of money from the stock.
Key Observations:
- The trend indicators suggest a potential uptrend in the short term.
- Momentum indicators show a neutral stance with mixed signals.
- Volatility is decreasing, indicating a possible consolidation phase.
- Volume indicators reflect uncertainty and lack of strong buying or selling pressure.
Conclusion:
Based on the analysis of the technical indicators, the stock price of AGO is likely to experience sideways movement in the coming days. The trend signals a potential uptrend, but the momentum, volatility, and volume indicators suggest a lack of clear direction. Investors should exercise caution and closely monitor the price action for any signs of a breakout or reversal. Consider holding positions or adopting a wait-and-see approach until clearer signals emerge in the technical indicators.