Technical Analysis of AGS 2024-05-10
Overview:
In analyzing the technical indicators for AGS over the last 5 days, we will delve into the trend, momentum, volatility, and volume indicators to provide a comprehensive outlook on the possible stock price movement in the coming days. By examining these key indicators, we aim to offer valuable insights and predictions to guide your investment decisions.
Trend Analysis:
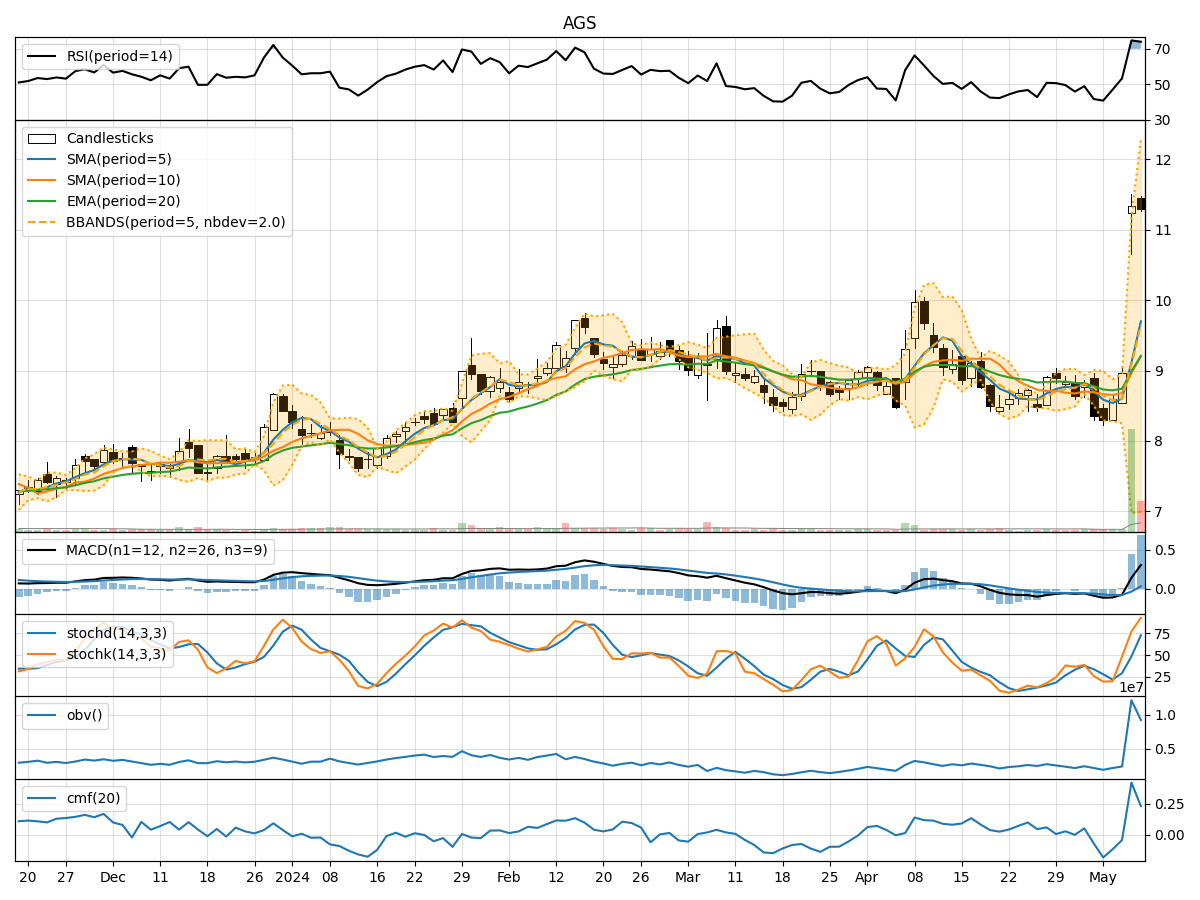
- Moving Averages (MA): The 5-day MA has been fluctuating around the closing prices, indicating short-term price trends. The SMA(10) and EMA(20) show a slight downward trend, suggesting a potential bearish sentiment.
- MACD: The MACD line has been negative, but the MACD Histogram has shown signs of improvement, moving towards the zero line. This could indicate a potential reversal in the short term.
Momentum Analysis:
- RSI: The RSI has been gradually increasing, reaching overbought levels, indicating a bullish momentum in the stock.
- Stochastic Oscillator: Both %K and %D have been rising, entering the overbought zone, suggesting a strong bullish momentum.
- Williams %R: The Williams %R is also in the oversold region, indicating a potential reversal to the upside.
Volatility Analysis:
- Bollinger Bands: The stock price has been trading above the upper Bollinger Band, indicating overbought conditions and a potential pullback in the near term.
- Bollinger %B: The %B indicator is above 0.8, suggesting an overbought condition and a possible correction.
Volume Analysis:
- On-Balance Volume (OBV): The OBV has been fluctuating, indicating indecision among investors regarding the stock.
- Chaikin Money Flow (CMF): The CMF has been negative, reflecting selling pressure in the stock.
Conclusion:
Based on the analysis of the technical indicators, the stock of AGS is currently exhibiting overbought conditions in terms of momentum and volatility. The trend indicators suggest a potential bearish sentiment in the short term, while the momentum indicators point towards a bullish momentum that might be losing steam due to overbought conditions.
Considering the conflicting signals from the indicators, it is likely that AGS may experience a short-term correction or consolidation before resuming its trend. Investors should exercise caution and consider taking profits or implementing risk management strategies in anticipation of a possible pullback in the stock price.
In conclusion, the next few days for AGS could see a sideways movement or a slight downward correction before a potential resumption of the bullish trend. It is essential to monitor the price action closely and adjust your investment strategy accordingly to navigate the market dynamics effectively.