Technical Analysis of AGX 2024-05-10
Overview:
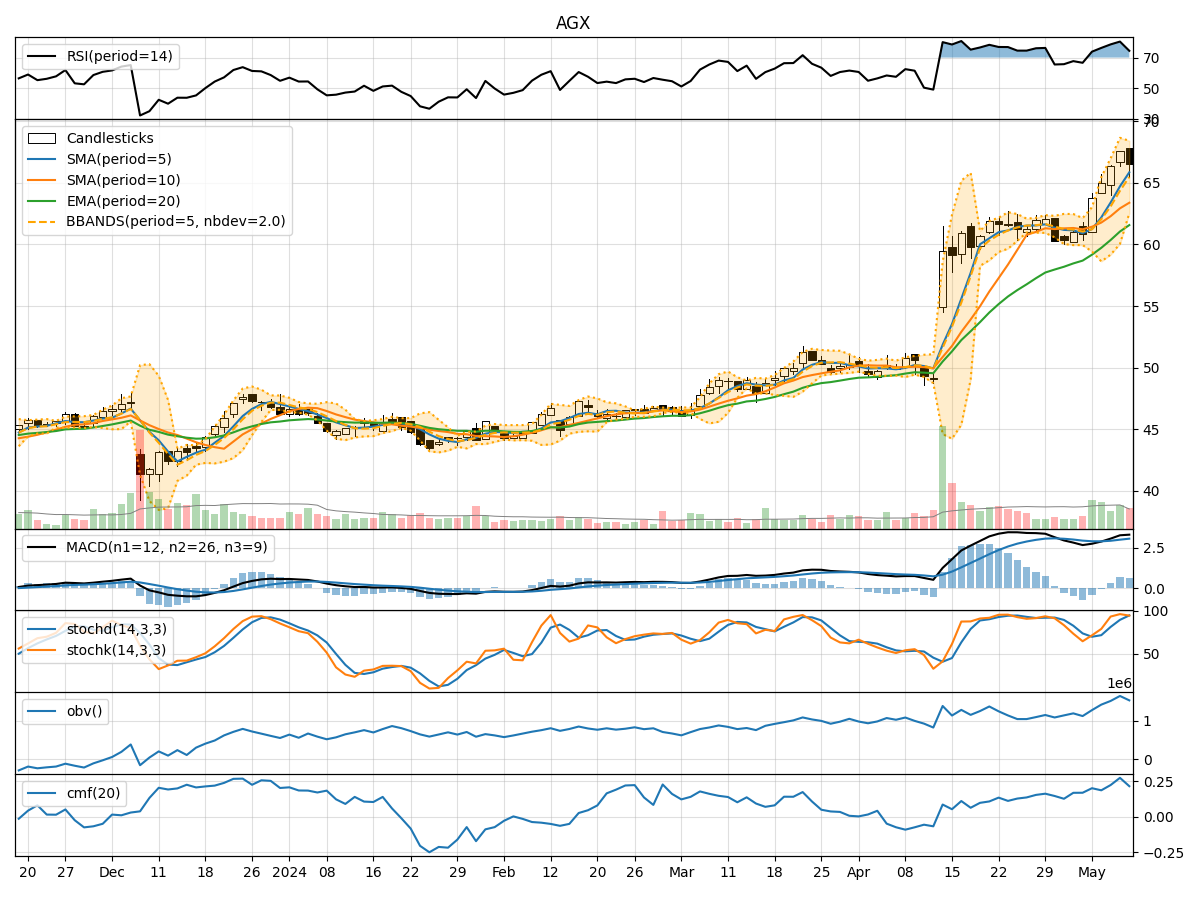
In the last 5 trading days, AGX stock has shown a consistent uptrend in both price and volume. The moving averages have been trending upwards, indicating a bullish sentiment. Momentum indicators like RSI and Stochastic oscillators suggest the stock is in overbought territory. Volatility indicators show an expanding Bollinger Bands width, indicating increased price volatility. Volume indicators like OBV and CMF show a positive accumulation of the stock.
Trend Analysis:
- Moving Averages (MA): The 5-day MA has been consistently above the 10-day SMA, indicating a short-term bullish trend. The EMA(20) is also trending upwards, supporting the bullish sentiment.
- MACD: The MACD line has been consistently above the signal line, indicating a bullish trend. The MACD histogram has been increasing, showing strengthening bullish momentum.
Momentum Analysis:
- RSI: The RSI is in overbought territory, suggesting that the stock may be due for a pullback or consolidation in the short term.
- Stochastic Oscillator: Both %K and %D lines are in the overbought zone, indicating a potential reversal or correction.
Volatility Analysis:
- Bollinger Bands (BB): The widening of the Bollinger Bands suggests increasing price volatility. The stock may experience larger price swings in the coming days.
Volume Analysis:
- On-Balance Volume (OBV): The OBV has been steadily increasing, indicating strong buying pressure and accumulation of the stock.
- Chaikin Money Flow (CMF): The CMF is positive, indicating that money is flowing into the stock.
Conclusion:
Based on the technical indicators and analysis: - Trend: The stock is in a strong upward trend. - Momentum: The stock is overbought and may experience a short-term pullback or consolidation. - Volatility: Increasing volatility suggests potential larger price movements. - Volume: Strong accumulation and positive money flow indicate bullish sentiment.
Forecast:
Given the current technical outlook, the next few days may see a short-term pullback or consolidation due to overbought conditions. However, the overall trend remains bullish. Traders should watch for potential entry points during pullbacks for long positions. It is essential to monitor key support levels and wait for confirmation signals before making trading decisions.