Technical Analysis of AIG 2024-05-10
Overview:
In analyzing the technical indicators for AIG over the last 5 days, we will delve into the trend, momentum, volatility, and volume indicators to provide a comprehensive outlook on the possible stock price movement in the coming days.
Trend Analysis:
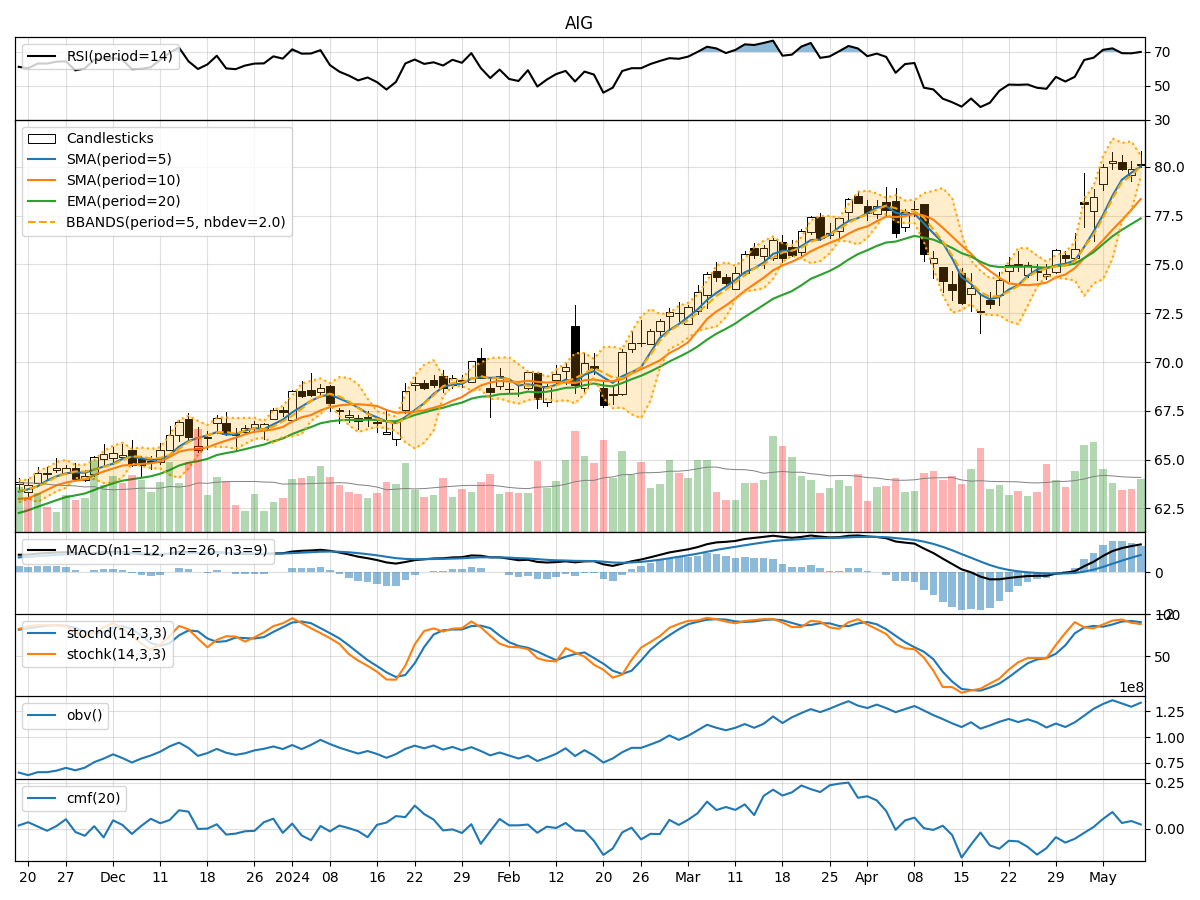
- Moving Averages (MA): The 5-day Moving Average (MA) has been consistently rising, indicating a bullish trend in the short term.
- MACD: The MACD line has been above the signal line, suggesting positive momentum in the stock price.
- EMA: The Exponential Moving Average (EMA) has also been trending upwards, supporting the bullish sentiment.
Momentum Analysis:
- RSI: The Relative Strength Index (RSI) has been in the overbought territory, indicating a strong bullish momentum.
- Stochastic Oscillator: Both %K and %D have been relatively high, suggesting a potential overbought condition.
- Williams %R: The Williams %R is in the oversold region, indicating a potential reversal in the short term.
Volatility Analysis:
- Bollinger Bands (BB): The stock price has been trading near the upper Bollinger Band, indicating high volatility and a potential overbought condition.
- Bollinger Band Width: The Band Width has been narrowing, suggesting a possible decrease in volatility.
Volume Analysis:
- On-Balance Volume (OBV): The OBV has been fluctuating, indicating mixed sentiment among investors.
- Chaikin Money Flow (CMF): The CMF has been positive but decreasing, signaling a potential weakening of buying pressure.
Key Observations and Opinions:
- Trend: The trend indicators suggest a strong bullish sentiment in the short term.
- Momentum: The momentum indicators point towards a potential overbought condition, signaling a need for caution.
- Volatility: High volatility near the upper Bollinger Band indicates a possible price correction.
- Volume: Mixed volume indicators suggest indecision among market participants.
Conclusion:
Based on the analysis of the technical indicators, the stock price of AIG is likely to experience a short-term correction due to the overbought momentum and high volatility near the upper Bollinger Band. Traders should exercise caution and consider taking profits or implementing risk management strategies. A downward movement or consolidation is expected in the coming days.