Technical Analysis of AIU 2024-05-10
Overview:
In analyzing the technical indicators for AIU stock over the last 5 days, we will delve into the trends, momentum, volatility, and volume indicators to provide a comprehensive outlook on the possible stock price movement in the coming days. By examining these key indicators, we aim to offer valuable insights and predictions for potential investors.
Trend Analysis:
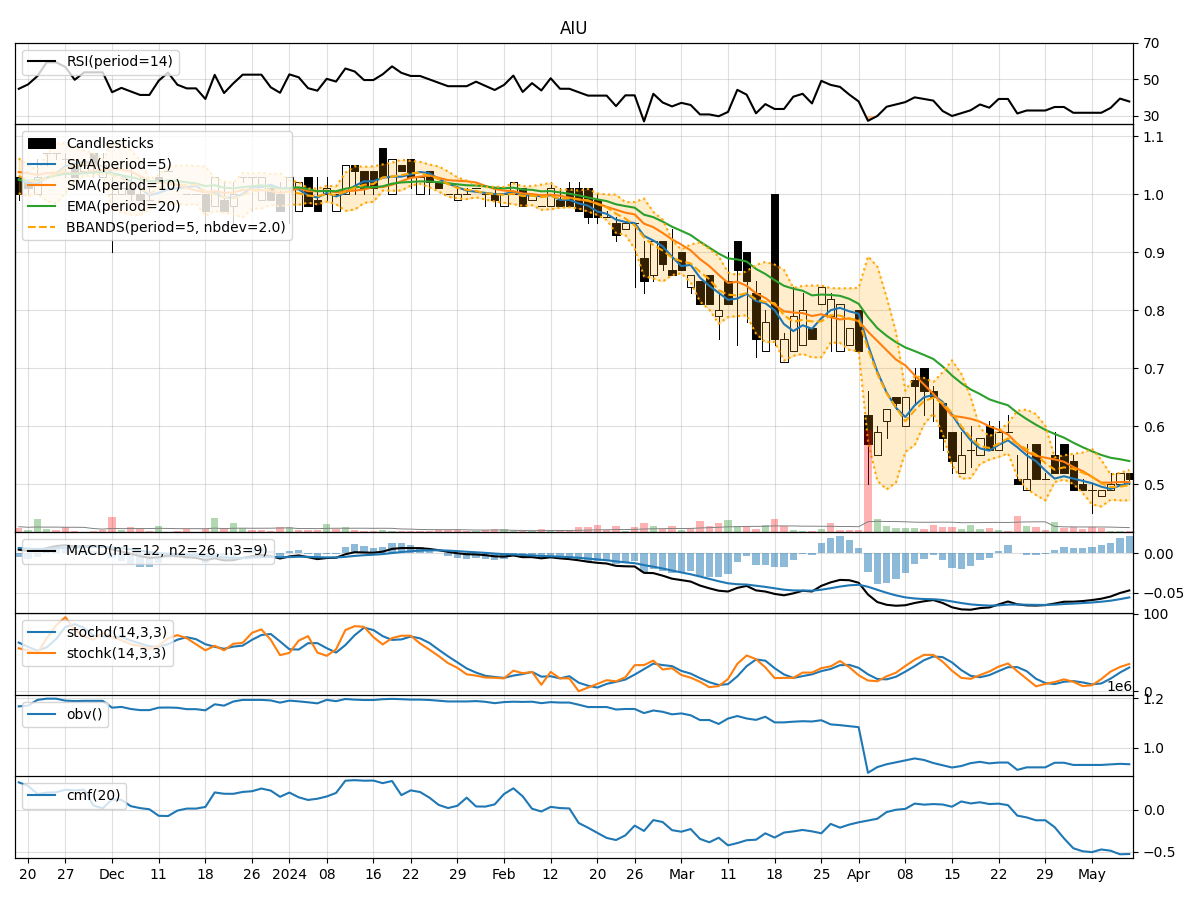
- Moving Averages (MA): The 5-day moving average (MA) has been declining slightly, indicating a short-term bearish trend.
- MACD: The MACD line has been consistently negative, suggesting a bearish momentum in the stock price.
- EMA: The exponential moving average (EMA) has been decreasing, reinforcing the bearish sentiment in the short to medium term.
Momentum Analysis:
- RSI: The Relative Strength Index (RSI) has been hovering around 30-40, indicating a slightly oversold condition but still within bearish territory.
- Stochastic Oscillator: Both %K and %D have been rising, but still below 50, signaling a potential reversal but not yet confirming a bullish trend.
- Williams %R: The Williams %R is in oversold territory, suggesting a possible bounce-back in the stock price.
Volatility Analysis:
- Bollinger Bands (BB): The stock price has been trading within the lower Bollinger Band, indicating a potential oversold condition.
- Bollinger Band Width: The Band Width has been narrowing, suggesting a decrease in volatility and a possible consolidation phase.
Volume Analysis:
- On-Balance Volume (OBV): The OBV has been declining, indicating selling pressure in the stock.
- Chaikin Money Flow (CMF): The CMF has been negative, reflecting a bearish money flow in the stock.
Key Observations:
- The stock is currently in a short-term bearish trend based on moving averages and MACD.
- Momentum indicators show a potential for a reversal, but confirmation is needed.
- Volatility is decreasing, indicating a possible consolidation phase.
- Volume indicators suggest ongoing selling pressure in the stock.
Conclusion:
Based on the analysis of technical indicators, the stock is likely to experience further downside movement in the near term. Investors should exercise caution and wait for confirmation of a trend reversal before considering any long positions. The stock may enter a consolidation phase before a potential reversal, so monitoring key support levels and waiting for bullish signals is advisable.