Technical Analysis of AJG 2024-05-10
Overview:
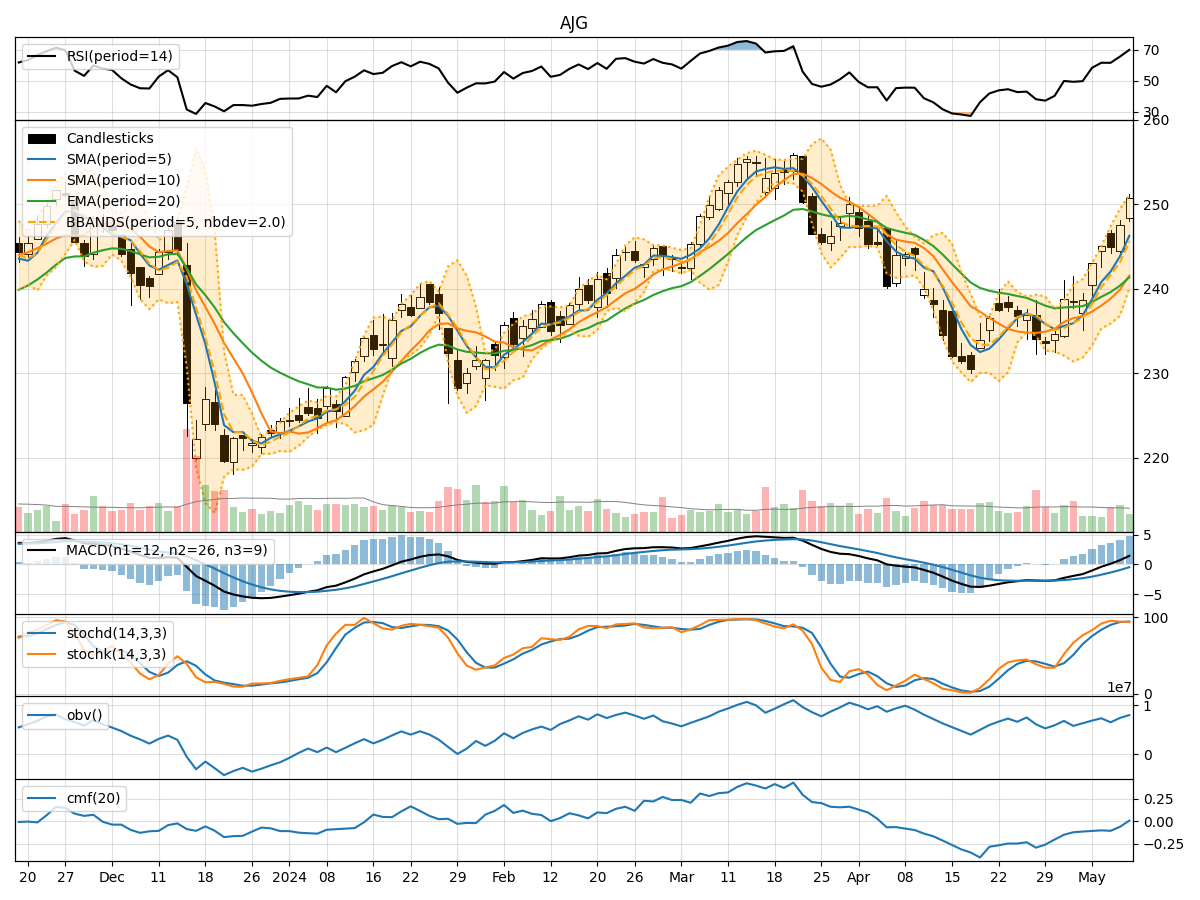
In analyzing the technical indicators for AJG over the last 5 days, we will delve into the trend, momentum, volatility, and volume indicators to provide a comprehensive outlook on the possible stock price movement. By examining these key aspects, we aim to offer valuable insights and predictions for the upcoming days.
Trend Analysis:
- Moving Averages (MA): The 5-day Moving Average (MA) has been consistently rising, indicating a bullish trend in the short term.
- MACD: The MACD line has been consistently above the signal line, suggesting bullish momentum.
- EMA: The Exponential Moving Average (EMA) has been trending upwards, supporting the bullish sentiment.
Momentum Analysis:
- RSI: The Relative Strength Index (RSI) has been increasing, indicating strengthening momentum.
- Stochastic Oscillator: Both %K and %D have been in overbought territory, suggesting a potential reversal or consolidation.
- Williams %R: The Williams %R is in oversold territory, indicating a possible buying opportunity.
Volatility Analysis:
- Bollinger Bands: The stock price has been consistently trading above the middle Bollinger Band, indicating an uptrend.
- Bollinger Band Width: The Band Width has been relatively stable, suggesting consistent volatility.
- Bollinger %B: The %B indicator has been above 0.5, indicating bullish momentum.
Volume Analysis:
- On-Balance Volume (OBV): The OBV has been fluctuating, indicating mixed buying and selling pressure.
- Chaikin Money Flow (CMF): The CMF has been negative, suggesting outflow of money from the stock.
Conclusion:
Based on the analysis of the technical indicators, the next few days for AJG are likely to see continued bullish momentum. The moving averages, MACD, and RSI all point towards a potential uptrend. However, caution is advised as the Stochastic Oscillator signals potential overbought conditions, which could lead to a short-term pullback or consolidation. The Bollinger Bands suggest a continuation of the uptrend, while volume indicators show mixed signals.
In conclusion, the overall outlook for AJG in the next few days is bullish, with the possibility of a short-term correction or consolidation. Traders and investors should closely monitor key levels and be prepared to adjust their positions accordingly.