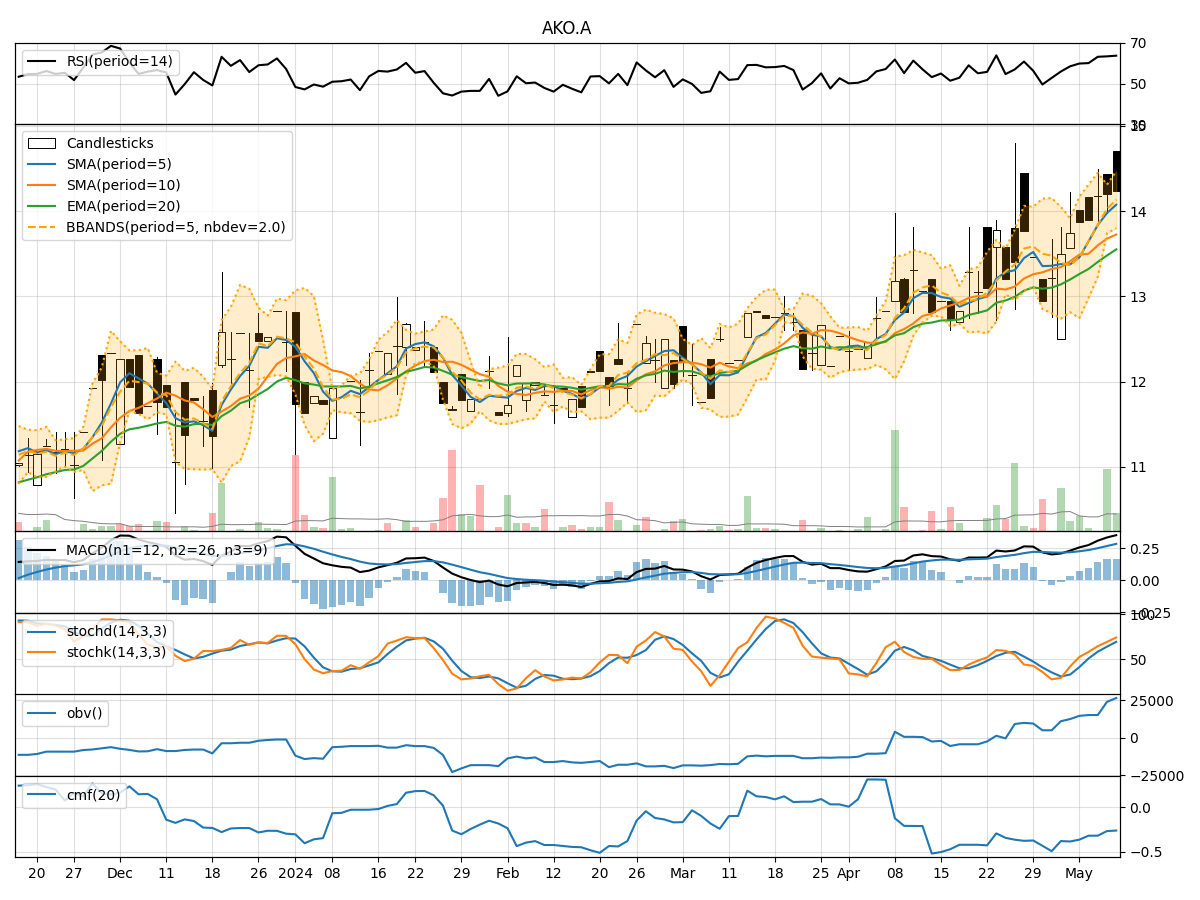
Technical Analysis of AKO.A 2024-05-10
Overview:
In analyzing the technical indicators for AKO.A over the last 5 days, we will delve into the trend, momentum, volatility, and volume indicators to provide a comprehensive outlook on the possible stock price movement in the coming days. By examining these key aspects, we aim to offer valuable insights and predictions to guide investment decisions.
Trend Indicators:
- Moving Averages (MA): The 5-day moving average has been consistently above the 10-day simple moving average, indicating a short-term bullish trend. The exponential moving average (EMA) has also been trending upwards, reflecting positive momentum.
- MACD: The MACD line has been above the signal line, suggesting bullish momentum in the stock price.
- Conclusion: The trend indicators point towards an upward trend in the stock price.
Momentum Indicators:
- RSI: The Relative Strength Index (RSI) has been hovering around 60, indicating a neutral stance in terms of momentum.
- Stochastic Oscillator: Both %K and %D have been rising, showing increasing buying pressure.
- Conclusion: Momentum indicators suggest a neutral to slightly bullish sentiment in the stock.
Volatility Indicators:
- Bollinger Bands: The stock price has been trading within the Bollinger Bands, with the bands narrowing slightly, indicating reduced volatility.
- Conclusion: Volatility indicators signal a consolidation phase in the stock price.
Volume Indicators:
- On-Balance Volume (OBV): The OBV has been increasing, indicating accumulation by investors.
- Chaikin Money Flow (CMF): The CMF has been negative, suggesting some selling pressure.
- Conclusion: Volume indicators show a mixed sentiment, with OBV indicating accumulation and CMF pointing towards selling pressure.
Overall Conclusion:
Based on the analysis of trend, momentum, volatility, and volume indicators, the next few days' possible stock price movement for AKO.A is likely to be upward with a neutral to slightly bullish momentum. The stock is expected to continue its upward trend supported by positive moving averages and MACD signals. However, the volatility indicators suggest a consolidation phase, so we may see some sideways movement in the near term. Investors should closely monitor the stock for any breakout or reversal signals to make informed trading decisions.
Key Recommendations:
- Monitor Moving Averages: Keep a close eye on the moving averages for any crossovers or divergences that could signal a change in trend.
- Watch for Breakouts: Look for the stock to break out of the Bollinger Bands as a potential signal of increased volatility and a new trend direction.
- Consider Volume Trends: Pay attention to volume trends to confirm the strength of the current price movement.
- Stay Informed: Stay updated on market news and events that could impact AKO.A's stock price movement.
By combining technical analysis with market insights, investors can make well-informed decisions to capitalize on potential opportunities in the stock market.