Technical Analysis of AKO.B 2024-05-10
Overview:
In analyzing the technical indicators for AKO.B over the last 5 days, we will delve into the trends, momentum, volatility, and volume indicators to provide a comprehensive outlook on the possible stock price movement in the coming days. By examining these key aspects, we aim to offer valuable insights and predictions to guide investment decisions.
Trend Analysis:
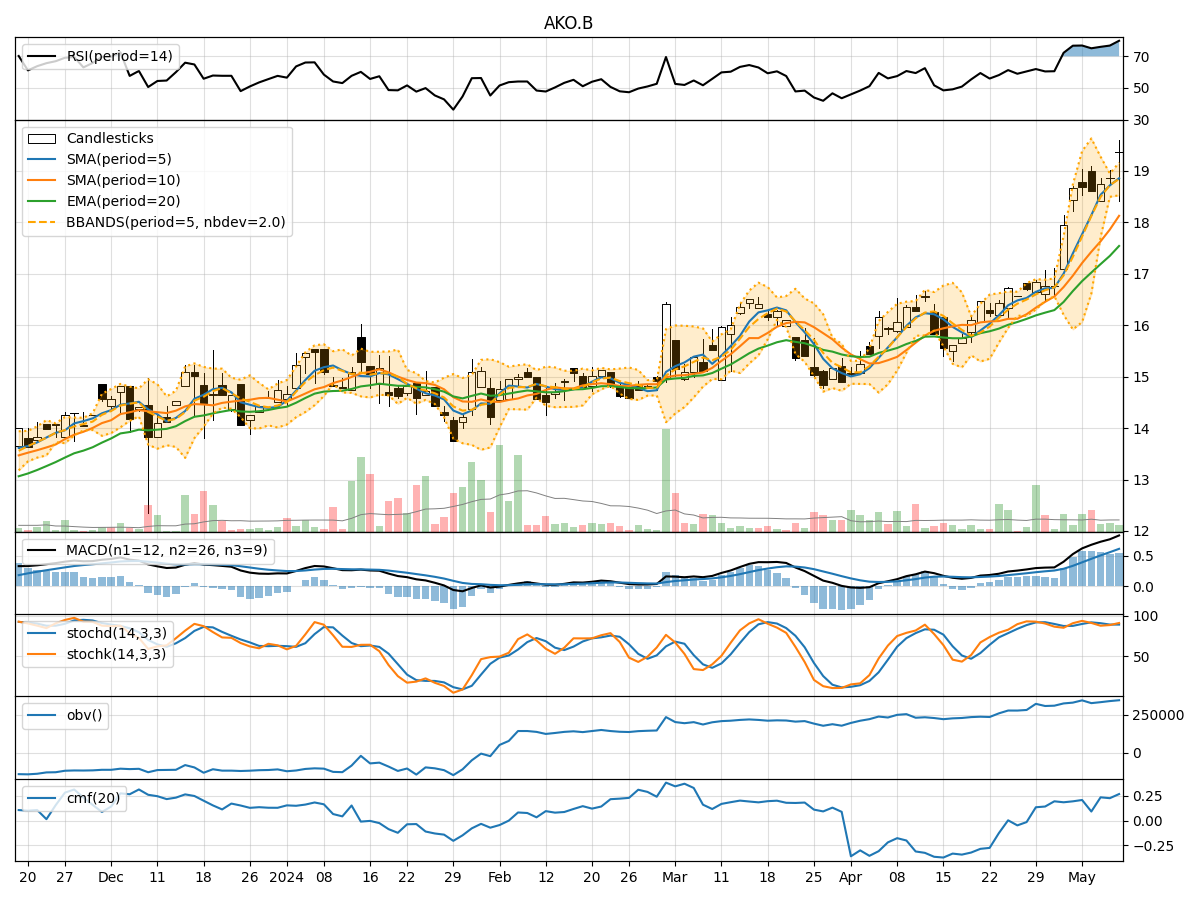
- Moving Averages (MA): The 5-day Moving Average (MA) has been consistently above the Simple Moving Average (SMA) and Exponential Moving Average (EMA), indicating a bullish trend.
- MACD: The MACD line has been consistently above the signal line, with both lines showing an upward trend, suggesting bullish momentum.
- RSI: The Relative Strength Index (RSI) has been in the overbought territory, indicating a strong bullish momentum.
Momentum Analysis:
- Stochastic Oscillator: Both %K and %D lines of the Stochastic Oscillator have been in the overbought zone, suggesting a potential reversal or consolidation.
- Williams %R: The Williams %R indicator has been consistently in the oversold region, indicating a strong bullish sentiment.
Volatility Analysis:
- Bollinger Bands (BB): The stock price has been trading within the upper Bollinger Band, indicating an overbought condition.
- Bollinger Band Width: The Band Width has been narrowing, suggesting a potential decrease in volatility.
Volume Analysis:
- On-Balance Volume (OBV): The OBV indicator has been showing a positive accumulation of volume, supporting the bullish trend.
- Chaikin Money Flow (CMF): The CMF has been consistently positive, indicating strong buying pressure.
Key Observations:
- The trend indicators suggest a strong bullish sentiment, supported by the moving averages and MACD.
- Momentum indicators show signs of potential overbought conditions, especially with the Stochastic Oscillator.
- Volatility has been relatively high, but the narrowing Bollinger Bands indicate a possible decrease in volatility.
- Volume indicators support the bullish trend, with positive OBV and CMF values.
Conclusion:
Based on the analysis of the technical indicators, the next few days for AKO.B are likely to see continued upward movement in the stock price. However, caution is advised as some momentum indicators suggest potential overbought conditions, which could lead to a short-term correction or consolidation. Investors should closely monitor the Stochastic Oscillator for any signs of a reversal. Overall, the outlook remains bullish with a potential for a short-term pullback before resuming the upward trend.