Technical Analysis of ALSN 2024-05-10
Overview:
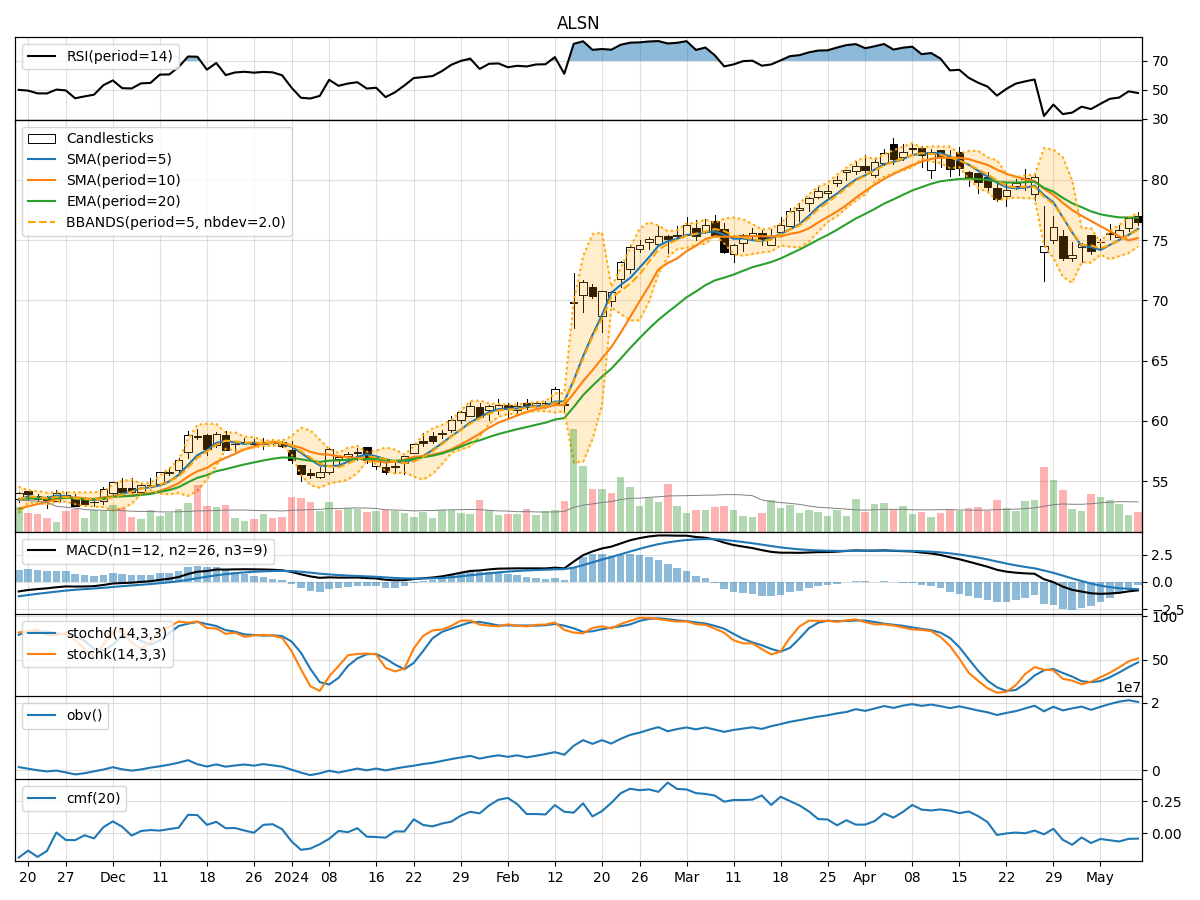
In analyzing the technical indicators for ALSN over the last 5 days, we will delve into the trend, momentum, volatility, and volume indicators to provide a comprehensive assessment of the stock's potential price movement. By examining these key factors, we aim to offer valuable insights and predictions for the next few days.
Trend Indicators:
- Moving Averages (MA): The 5-day MA has been fluctuating around the closing prices, indicating short-term price trends. The SMA(10) and EMA(20) show a downward trend, suggesting a bearish sentiment.
- MACD: The MACD line has been consistently below the signal line, indicating a bearish trend in the stock price momentum.
- MACD Histogram: The negative values of the MACD Histogram further confirm the bearish momentum in the stock.
Momentum Indicators:
- RSI: The RSI has been hovering around 50, indicating a neutral sentiment with no clear overbought or oversold conditions.
- Stochastic Oscillator: Both %K and %D lines of the Stochastic Oscillator have been moving upwards, suggesting a potential bullish momentum.
- Williams %R: The Williams %R is in the oversold territory, indicating a possible reversal in the stock price.
Volatility Indicators:
- Bollinger Bands: The stock price has been trading within the Bollinger Bands, with no significant breaches, indicating a period of consolidation.
- Bollinger %B: The %B value is below 1, suggesting that the stock is trading below the lower Bollinger Band, potentially indicating an oversold condition.
Volume Indicators:
- On-Balance Volume (OBV): The OBV has been fluctuating, indicating mixed buying and selling pressure in the stock.
- Chaikin Money Flow (CMF): The CMF has been negative, indicating a bearish money flow into the stock over the past 20 days.
Key Observations:
- The trend indicators suggest a bearish sentiment with moving averages pointing downwards.
- Momentum indicators show mixed signals with the Stochastic Oscillator hinting at a potential bullish reversal.
- Volatility indicators indicate a period of consolidation with the stock trading within the Bollinger Bands.
- Volume indicators reflect mixed buying and selling pressure with a bearish money flow.
Conclusion:
Based on the analysis of the technical indicators, the next few days for ALSN could see sideways movement or a slight bullish reversal. While the trend indicators point towards a bearish sentiment, the momentum indicators, particularly the Stochastic Oscillator, suggest a potential bullish momentum. The volatility indicators indicate a period of consolidation, supporting the possibility of sideways movement. However, the mixed signals from volume indicators warrant caution in predicting a clear direction.
In conclusion, investors should closely monitor the stock's price action and key technical levels to make informed trading decisions. It is advisable to wait for more confirmation from the indicators before taking significant positions in ALSN.