Technical Analysis of ALTG 2024-05-31
Overview:
In analyzing the technical indicators for ALTG over the last 5 days, we will delve into the trend, momentum, volatility, and volume indicators to provide a comprehensive outlook on the possible stock price movement in the coming days. By examining these key aspects, we aim to offer valuable insights and predictions for informed decision-making.
Trend Analysis:
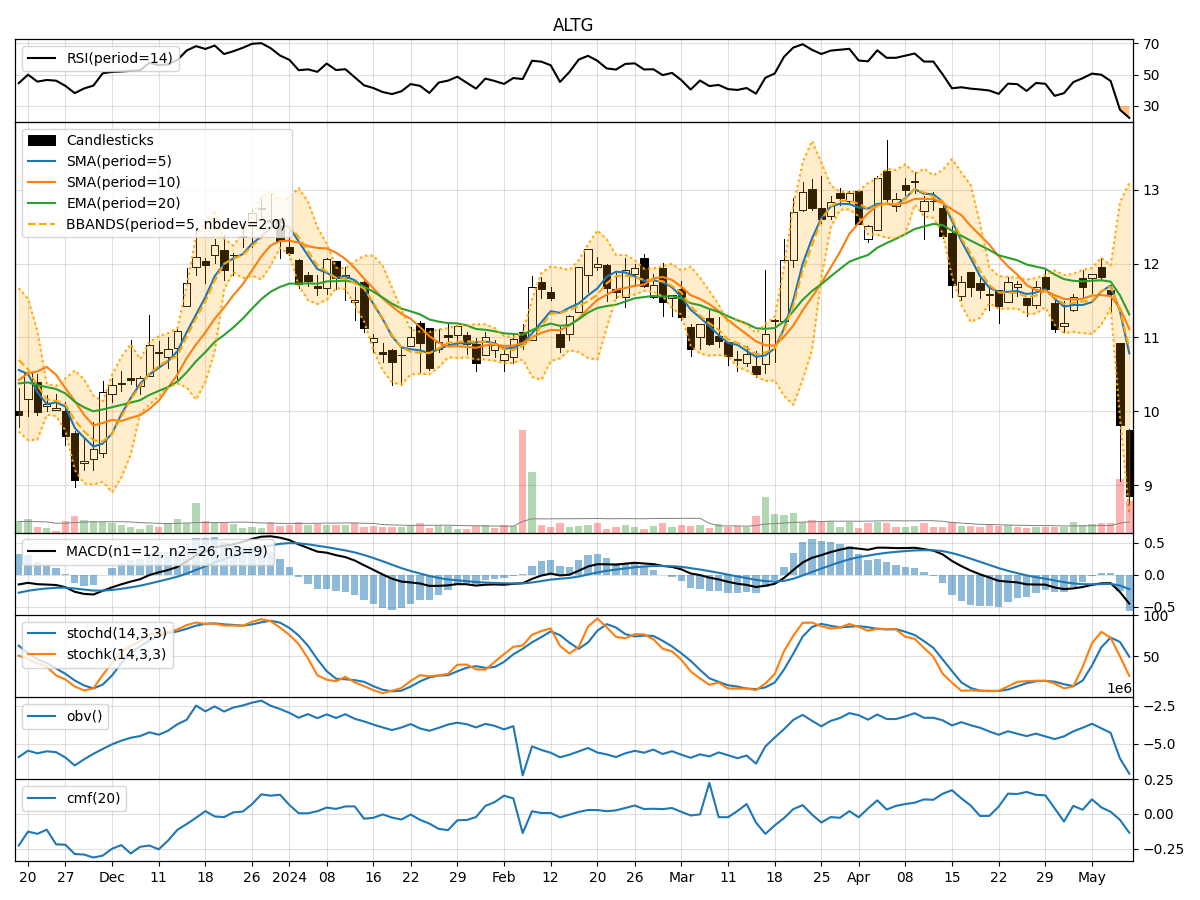
- Moving Averages (MA): The 5-day Moving Average (MA) has been fluctuating around the closing prices, indicating short-term price trends. The Simple Moving Average (SMA) and Exponential Moving Average (EMA) show a downward trend, suggesting a bearish sentiment in the market.
- MACD: The Moving Average Convergence Divergence (MACD) and its signal line (MACDH) have been negative, indicating a bearish momentum in the stock price.
Momentum Analysis:
- RSI: The Relative Strength Index (RSI) has been hovering around 30-40, indicating a slightly oversold condition but not reaching extreme levels. This suggests a neutral to slightly bearish momentum.
- Stochastic Oscillator: The Stochastics show a mixed signal with values fluctuating, indicating indecision in the market sentiment.
Volatility Analysis:
- Bollinger Bands (BB): The Bollinger Bands have been narrowing, indicating decreasing volatility in the stock price. This could suggest a period of consolidation or a potential breakout in the near future.
Volume Analysis:
- On-Balance Volume (OBV): The OBV has been negative, indicating selling pressure in the stock. This aligns with the bearish trend and momentum indicators.
- Chaikin Money Flow (CMF): The CMF has been negative, reflecting a lack of buying interest and potential weakness in the stock price.
Key Observations:
- The trend indicators, momentum oscillators, and volume indicators collectively point towards a bearish sentiment in the stock.
- The narrowing Bollinger Bands suggest a potential breakout in the near future, possibly indicating a shift in the current trend.
- The lack of significant buying interest, as indicated by OBV and CMF, supports the bearish outlook.
Conclusion:
Based on the analysis of the technical indicators, the next few days' possible stock price movement for ALTG is likely to be downward or sideways with a potential for a breakout. Traders and investors should exercise caution and consider waiting for a clearer signal before making any significant trading decisions. The overall outlook remains bearish, and it is advisable to closely monitor the price action for any potential reversal or continuation patterns before taking any positions.