Technical Analysis of ALV 2024-05-10
Overview:
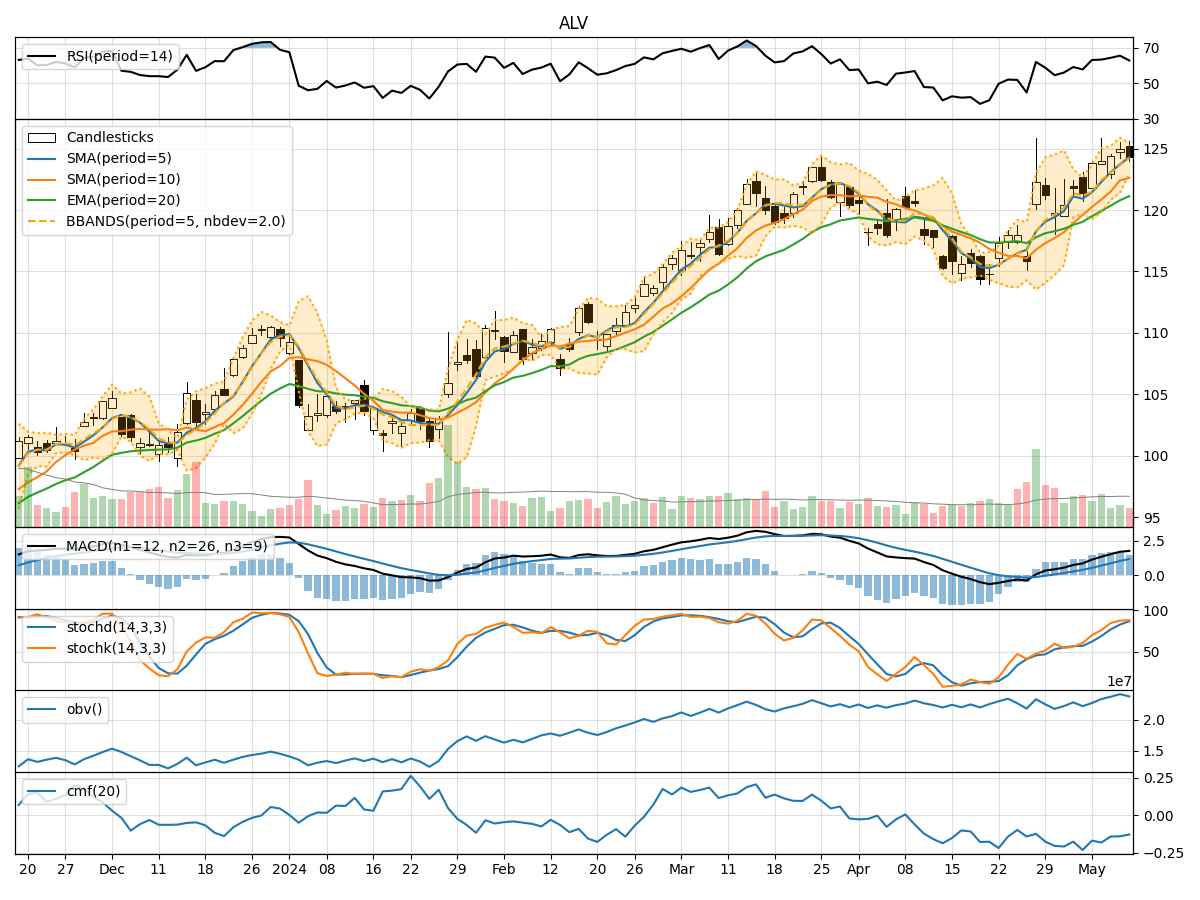
In the last 5 trading days, ALV stock has shown a consistent uptrend in its price movement. The moving averages have been trending upwards, with the MACD indicating a strengthening bullish momentum. The RSI and Stochastic indicators also suggest that the stock is in overbought territory. Volatility has been relatively stable, and the OBV indicator shows a slight decline in buying pressure.
Trend Indicators Analysis:
- Moving Averages (MA): The 5-day MA has been consistently above the longer-term SMAs, indicating a bullish trend.
- MACD: The MACD line has been above the signal line, indicating a bullish momentum.
- MACD Histogram: The histogram has been increasing, showing a strengthening bullish momentum.
Momentum Indicators Analysis:
- RSI: The RSI is in overbought territory, suggesting a potential reversal or consolidation.
- Stochastic Oscillator: Both %K and %D are in the overbought zone, indicating a possible pullback.
- Williams %R: The stock is in oversold territory, signaling a potential reversal.
Volatility Indicators Analysis:
- Bollinger Bands: The stock price has been trading within the bands, indicating stable volatility.
- Bollinger %B: The %B is relatively low, suggesting a potential increase in volatility.
Volume Indicators Analysis:
- On-Balance Volume (OBV): The OBV has been slightly declining, indicating weakening buying pressure.
- Chaikin Money Flow (CMF): The CMF is negative, suggesting a lack of buying interest.
Key Observations:
- The stock is currently in overbought territory based on the RSI and Stochastic indicators.
- The OBV indicator shows a slight decline in buying pressure.
- Volatility has been relatively stable, but the Bollinger %B indicates a potential increase in volatility.
Conclusion:
Based on the technical indicators and analysis: - Short-Term: The stock may experience a pullback or consolidation in the next few days due to being in overbought territory and weakening buying pressure. - Medium-Term: The bullish trend is still intact, but a temporary correction or sideways movement is likely before a potential continuation of the uptrend. - Long-Term: The overall trend remains bullish, but caution is advised due to the overbought conditions and declining buying pressure.
Recommendation:
- Short-Term Traders: Consider taking profits or setting tight stop-loss orders to protect gains.
- Medium to Long-Term Investors: Hold positions but monitor closely for potential signs of a reversal or consolidation.
Disclaimer:
Always remember that technical analysis is not foolproof and should be used in conjunction with other forms of analysis. Market conditions can change rapidly, so it's essential to stay informed and adapt your strategy accordingly.