Technical Analysis of AMBP 2024-05-10
Overview:
In analyzing the technical indicators for AMBP over the last 5 days, we will delve into the trend, momentum, volatility, and volume indicators to provide a comprehensive outlook on the possible stock price movement in the coming days. By examining these key indicators, we aim to offer valuable insights and predictions for informed decision-making.
Trend Analysis:
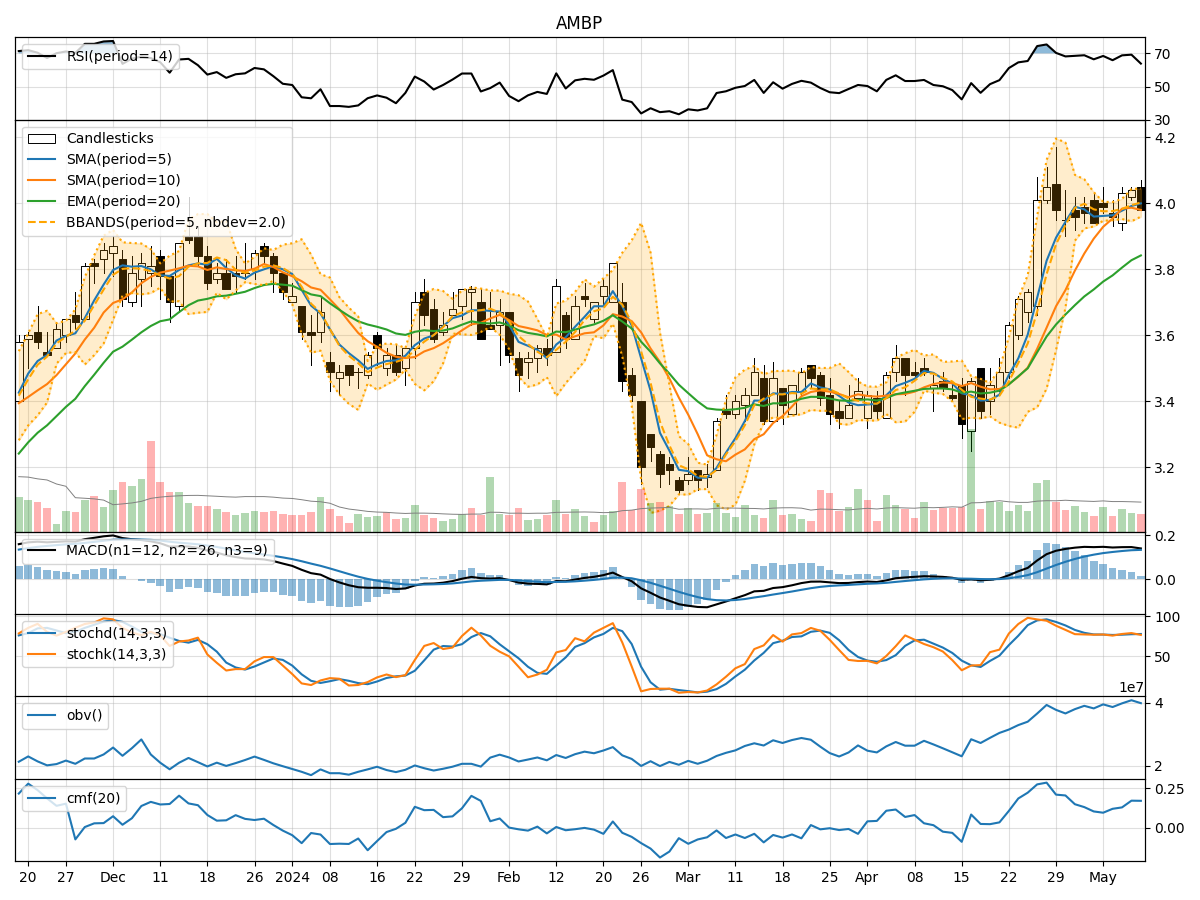
- Moving Averages (MA): The 5-day MA has been relatively stable around the closing prices, indicating a short-term trend. The SMA(10) and EMA(20) have shown a gradual uptrend, suggesting a positive momentum in the stock price.
- MACD: The MACD line has been consistently above the signal line, indicating a bullish trend. The MACD histogram has been positive, further supporting the uptrend in the stock price.
Momentum Analysis:
- RSI: The RSI has been fluctuating around the overbought territory, suggesting a strong bullish momentum in the stock. However, there might be a potential for a slight pullback due to the high RSI levels.
- Stochastic Oscillator: Both %K and %D lines have been in the overbought zone, indicating a strong buying momentum. This could potentially lead to a continuation of the bullish trend in the stock price.
Volatility Analysis:
- Bollinger Bands: The stock price has been trading within the upper Bollinger Band, indicating an overbought condition. This could suggest a potential reversal or consolidation in the stock price in the near term.
- Bollinger %B: The %B indicator has been hovering around the upper band, signaling a potential overvaluation of the stock. This could lead to a correction or a period of consolidation.
Volume Analysis:
- On-Balance Volume (OBV): The OBV indicator has shown a positive trend, indicating accumulation by investors. This suggests a bullish sentiment in the stock.
- Chaikin Money Flow (CMF): The CMF has been positive, reflecting strong buying pressure in the stock. This could support further upward movement in the stock price.
Conclusion:
Based on the analysis of the technical indicators, the stock of AMBP is currently in a strong bullish trend supported by positive momentum and volume indicators. However, the overbought conditions indicated by the RSI and Stochastic Oscillator, along with the upper Bollinger Band and %B levels, suggest a potential for a short-term correction or consolidation in the stock price.
Investors should closely monitor the price action and key support levels to assess the sustainability of the current uptrend. A pullback towards the moving averages or a period of consolidation within the Bollinger Bands could present buying opportunities for traders looking to enter or add to their positions in AMBP.