Technical Analysis of AMCR 2024-05-10
Overview:
In analyzing the technical indicators for AMCR over the last 5 days, we will delve into the trend, momentum, volatility, and volume indicators to provide a comprehensive outlook on the possible stock price movement in the coming days. By examining key metrics such as moving averages, MACD, RSI, Bollinger Bands, and OBV, we aim to offer valuable insights and predictions for informed decision-making.
Trend Indicators:
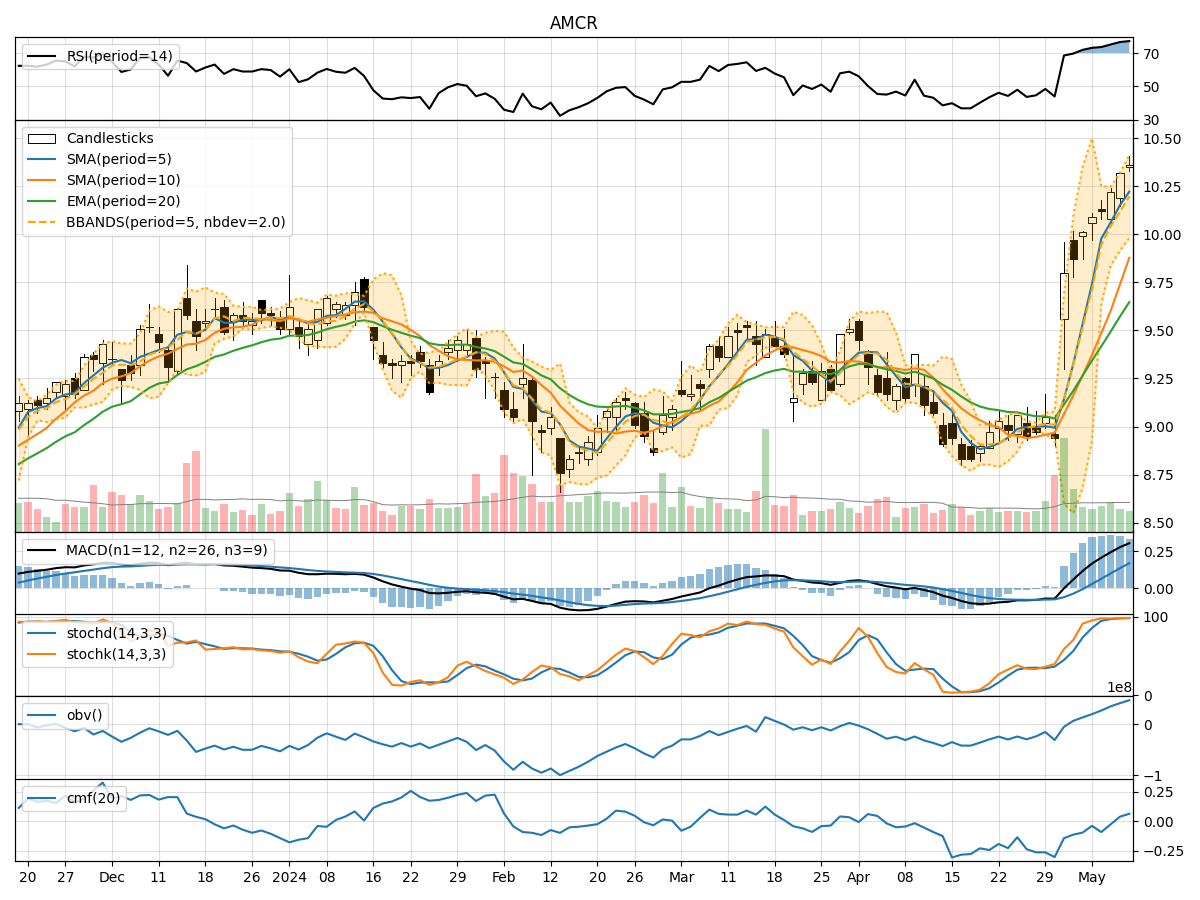
- Moving Averages (MA): The 5-day MA has been consistently above the closing prices, indicating a bullish trend.
- MACD: The MACD line has been above the signal line, suggesting positive momentum.
- EMA: The exponential moving average has been trending upwards, supporting a bullish sentiment.
Momentum Indicators:
- RSI: The RSI has been in the overbought territory, indicating a strong bullish momentum.
- Stochastic Oscillator: Both %K and %D have been in the overbought zone, signaling a potential reversal.
- Williams %R: The indicator has been in the oversold region, suggesting a possible price correction.
Volatility Indicators:
- Bollinger Bands: The stock price has been trading near the upper Bollinger Band, indicating high volatility.
- Bollinger %B: The %B value has been fluctuating, reflecting the price's proximity to the bands.
Volume Indicators:
- On-Balance Volume (OBV): The OBV has shown a slight increase, suggesting accumulation by investors.
- Chaikin Money Flow (CMF): The CMF has been negative, indicating selling pressure in the market.
Key Observations:
- The trend indicators point towards a bullish sentiment with moving averages and MACD supporting upward momentum.
- Momentum indicators like RSI and Stochastic Oscillator suggest overbought conditions, potentially leading to a price correction.
- Volatility indicators show high price fluctuations near the upper Bollinger Band, indicating increased market volatility.
- Volume indicators reflect mixed signals with OBV showing accumulation while CMF indicates selling pressure.
Conclusion:
Based on the analysis of technical indicators, the stock price of AMCR is likely to experience a short-term correction due to overbought conditions indicated by momentum indicators like RSI and Stochastic Oscillator. However, the overall trend remains bullish supported by moving averages and MACD. Investors should exercise caution and consider potential profit-taking opportunities in the near future.