Technical Analysis of AMR 2024-05-31
Overview:
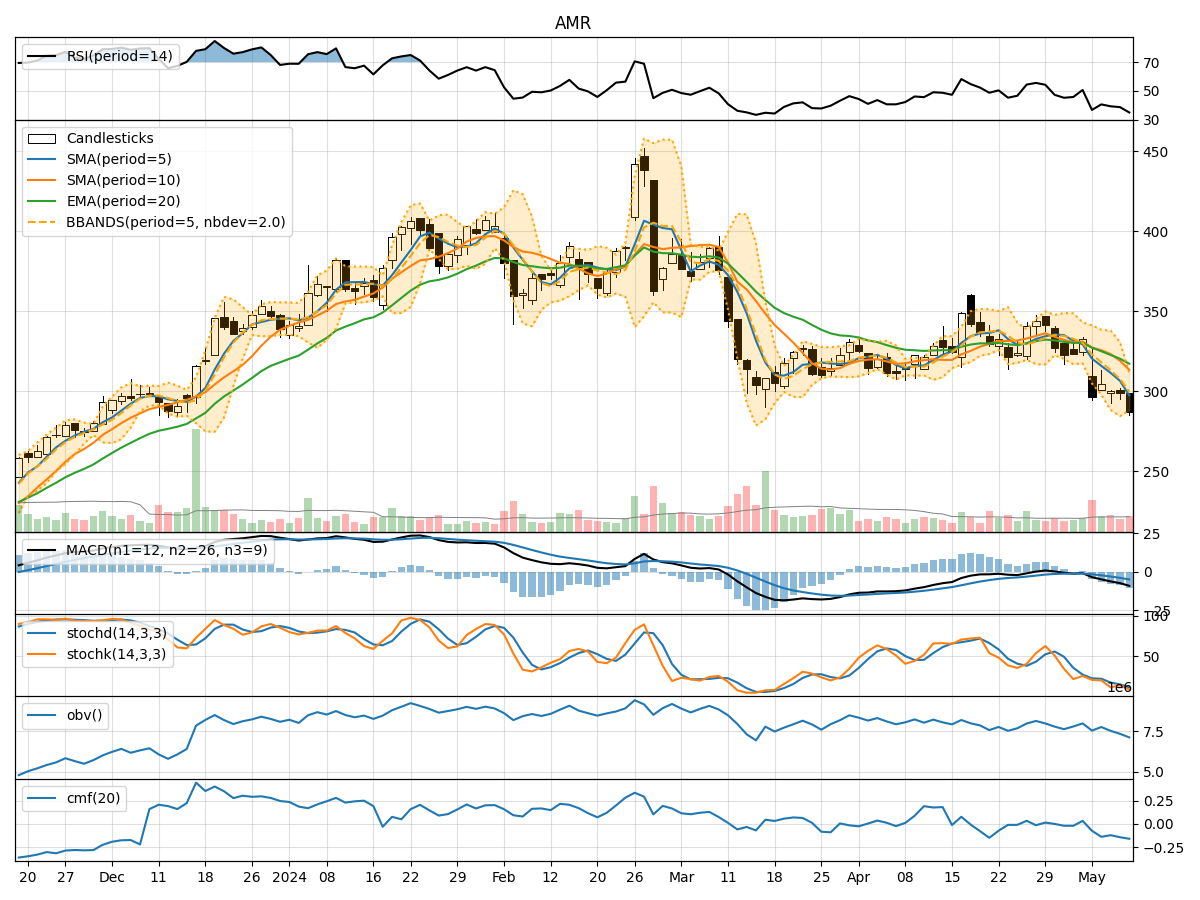
In analyzing the technical indicators for AMR over the last 5 days, we will delve into the trend, momentum, volatility, and volume indicators to provide a comprehensive outlook on the possible stock price movement in the coming days.
Trend Analysis:
- Moving Averages (MA): The 5-day Moving Average (MA) has been consistently rising, indicating a bullish trend in the short term.
- MACD: The MACD line has been increasing, showing bullish momentum.
- EMA: The Exponential Moving Average (EMA) has also been on an upward trajectory, supporting the bullish trend.
Momentum Analysis:
- RSI: The Relative Strength Index (RSI) has been increasing, suggesting strengthening momentum.
- Stochastic Oscillator: Both %K and %D have been rising, indicating bullish momentum.
- Williams %R: The indicator has been fluctuating but remains in the oversold territory, potentially signaling a reversal.
Volatility Analysis:
- Bollinger Bands (BB): The bands have been widening, indicating increased volatility in the stock price.
- Bollinger %B: The %B has been fluctuating within the bands, reflecting the volatility in the price movements.
Volume Analysis:
- On-Balance Volume (OBV): The OBV has been fluctuating but generally trending downwards, suggesting selling pressure.
- Chaikin Money Flow (CMF): The CMF has been negative, indicating a lack of buying pressure.
Key Observations:
- The trend indicators suggest a bullish sentiment in the short term.
- Momentum indicators show increasing strength in the stock price movement.
- Volatility has been on the rise, indicating potential price fluctuations.
- Volume indicators point towards selling pressure and a lack of significant buying interest.
Conclusion:
Based on the analysis of the technical indicators, the next few days for AMR stock price movement are likely to be upward with continued bullish momentum. However, the increasing volatility and selling pressure indicated by volume indicators may lead to some short-term fluctuations. Traders should closely monitor the price action and key support/resistance levels for potential entry or exit points.
Recommendation:
Considering the overall bullish outlook, investors may consider buying opportunities on pullbacks or consolidations to capitalize on the upward momentum. It is essential to set stop-loss levels to manage risks effectively and stay informed about any significant market developments that could impact the stock price.