Technical Analysis of AQN 2024-05-10
Overview:
In analyzing the technical indicators for AQN over the last 5 days, we will delve into the trend, momentum, volatility, and volume indicators to provide a comprehensive outlook on the possible stock price movement in the coming days.
Trend Analysis:
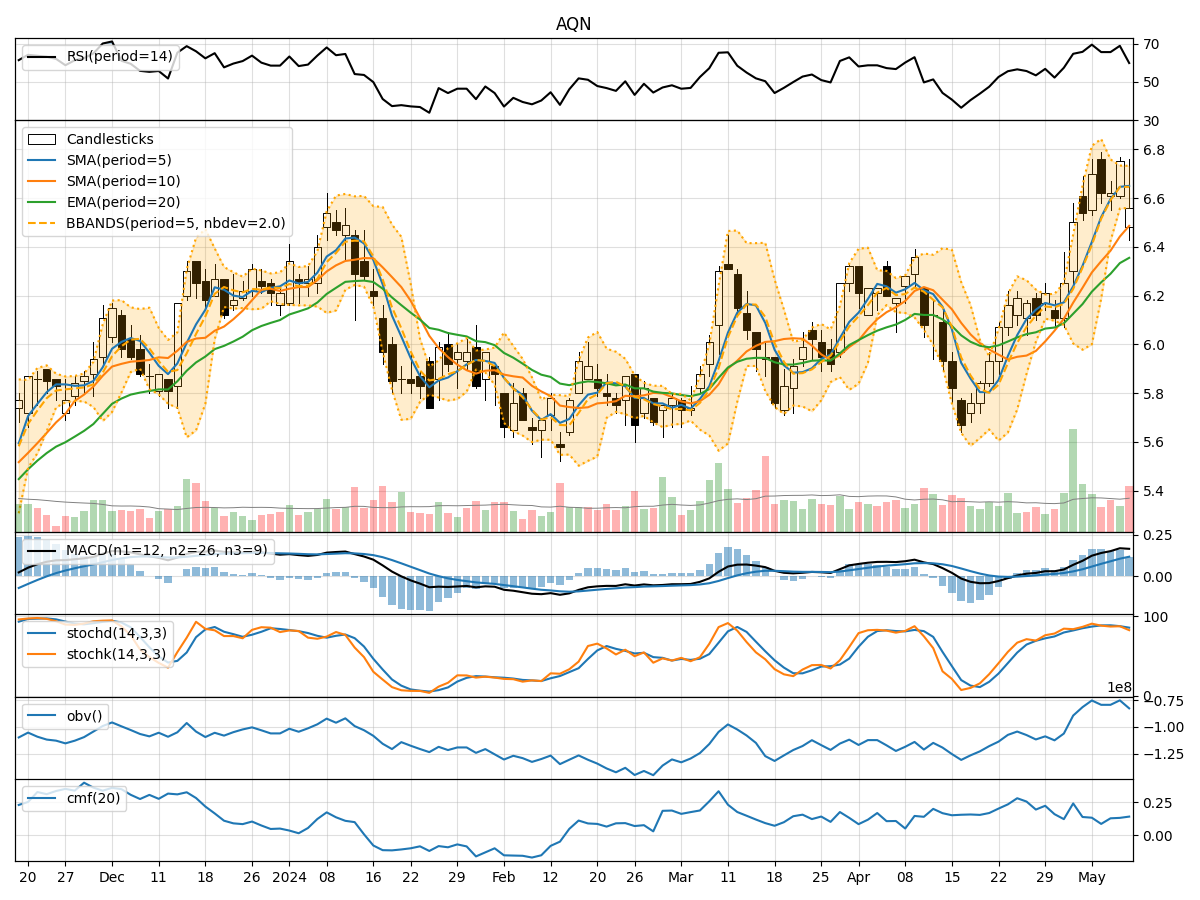
- Moving Averages (MA): The 5-day Moving Average (MA) has been consistently above the Simple Moving Average (SMA) and Exponential Moving Average (EMA), indicating a bullish trend.
- MACD: The MACD line has been consistently above the signal line, with the MACD Histogram showing positive values, suggesting a bullish momentum.
Momentum Analysis:
- RSI: The Relative Strength Index (RSI) has been fluctuating but generally staying within the neutral to slightly overbought territory, indicating a balanced momentum.
- Stochastic Oscillator: Both %K and %D lines of the Stochastic Oscillator have been in the overbought zone, suggesting a potential reversal or consolidation.
Volatility Analysis:
- Bollinger Bands (BB): The stock price has been mostly within the Bollinger Bands, with the bands narrowing, indicating decreasing volatility.
- Bollinger %B (BBP): The %B indicator has been fluctuating around the midline, suggesting a lack of clear direction in price movement.
Volume Analysis:
- On-Balance Volume (OBV): The OBV has shown mixed signals, with some days seeing an increase in volume and others experiencing a decrease.
- Chaikin Money Flow (CMF): The CMF has been positive, indicating buying pressure in the stock.
Conclusion:
Based on the analysis of the technical indicators, the stock of AQN is currently exhibiting a bullish trend with positive momentum. However, the overbought conditions in the Stochastic Oscillator and the fluctuating RSI signal a potential consolidation or pullback in the near term. The narrowing Bollinger Bands suggest decreasing volatility, which could lead to a period of sideways movement.
Considering the overall picture, it is likely that AQN's stock price may experience a short-term consolidation or sideways movement before potentially resuming its upward trend. Traders should monitor key support and resistance levels along with the Stochastic Oscillator and RSI for potential reversal signals.