Technical Analysis of ARE 2024-05-10
Overview:
In analyzing the technical indicators for the stock of ARE over the last 5 days, we will delve into the trend, momentum, volatility, and volume indicators to provide a comprehensive assessment of the stock's potential price movement. By examining these key factors, we aim to offer valuable insights and predictions for the next few days.
Trend Indicators:
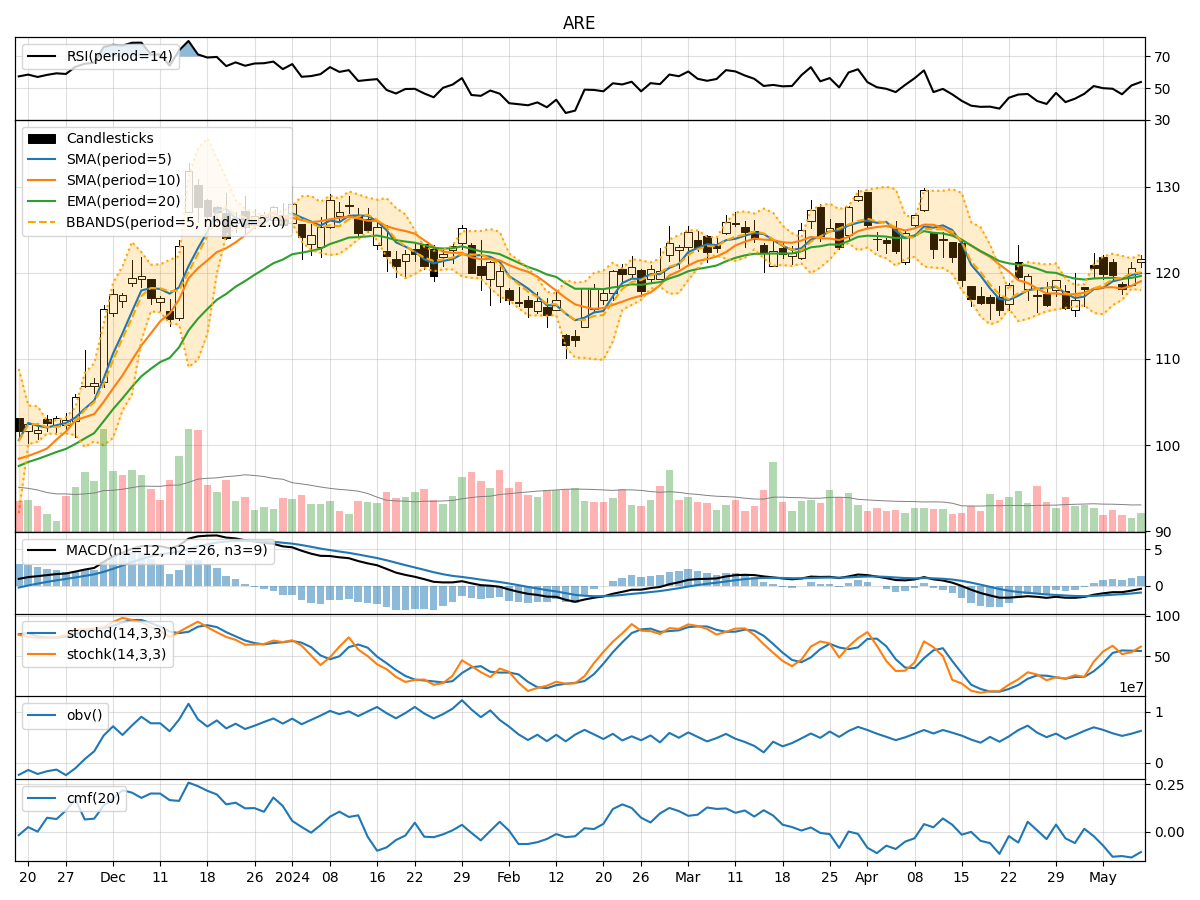
- Moving Averages (MA): The 5-day Moving Average (MA) has been fluctuating around the Simple Moving Average (SMA) and Exponential Moving Average (EMA) values, indicating a lack of clear trend direction.
- MACD: The Moving Average Convergence Divergence (MACD) has been negative, with the MACD line consistently below the signal line, suggesting a bearish momentum.
- MACD Histogram: The MACD Histogram has been decreasing, indicating a weakening bearish momentum.
Momentum Indicators:
- RSI: The Relative Strength Index (RSI) has been hovering around the 50 level, reflecting a neutral momentum in the stock.
- Stochastic Oscillator: Both %K and %D lines of the Stochastic Oscillator have been fluctuating, showing indecision in momentum.
- Williams %R: The Williams %R indicator has been oscillating in the oversold and neutral zones, signaling a lack of clear momentum direction.
Volatility Indicators:
- Bollinger Bands: The Bollinger Bands have been narrowing, suggesting decreasing volatility in the stock price.
- Bollinger %B: The %B indicator has been relatively stable, indicating the stock price is trading within the bands without extreme movements.
Volume Indicators:
- On-Balance Volume (OBV): The OBV has shown mixed movements, reflecting uncertainty in the buying and selling pressure.
- Chaikin Money Flow (CMF): The CMF has been negative, indicating a lack of strong buying pressure in the stock.
Key Observations and Opinions:
- Trend: The stock is currently lacking a clear trend direction, with the MACD signaling a bearish bias.
- Momentum: Momentum indicators are mixed, suggesting indecision among traders regarding the stock's future direction.
- Volatility: Volatility has been decreasing, indicating a potential period of consolidation or sideways movement.
- Volume: The volume indicators show mixed signals, reflecting uncertainty in market participation.
Conclusion:
Based on the analysis of the technical indicators, the stock of ARE is likely to experience sideways movement in the next few days. The lack of a clear trend, mixed momentum signals, decreasing volatility, and uncertain volume patterns suggest a period of consolidation. Traders should exercise caution and wait for clearer signals before making significant trading decisions.