Technical Analysis of ARW 2024-05-10
Overview:
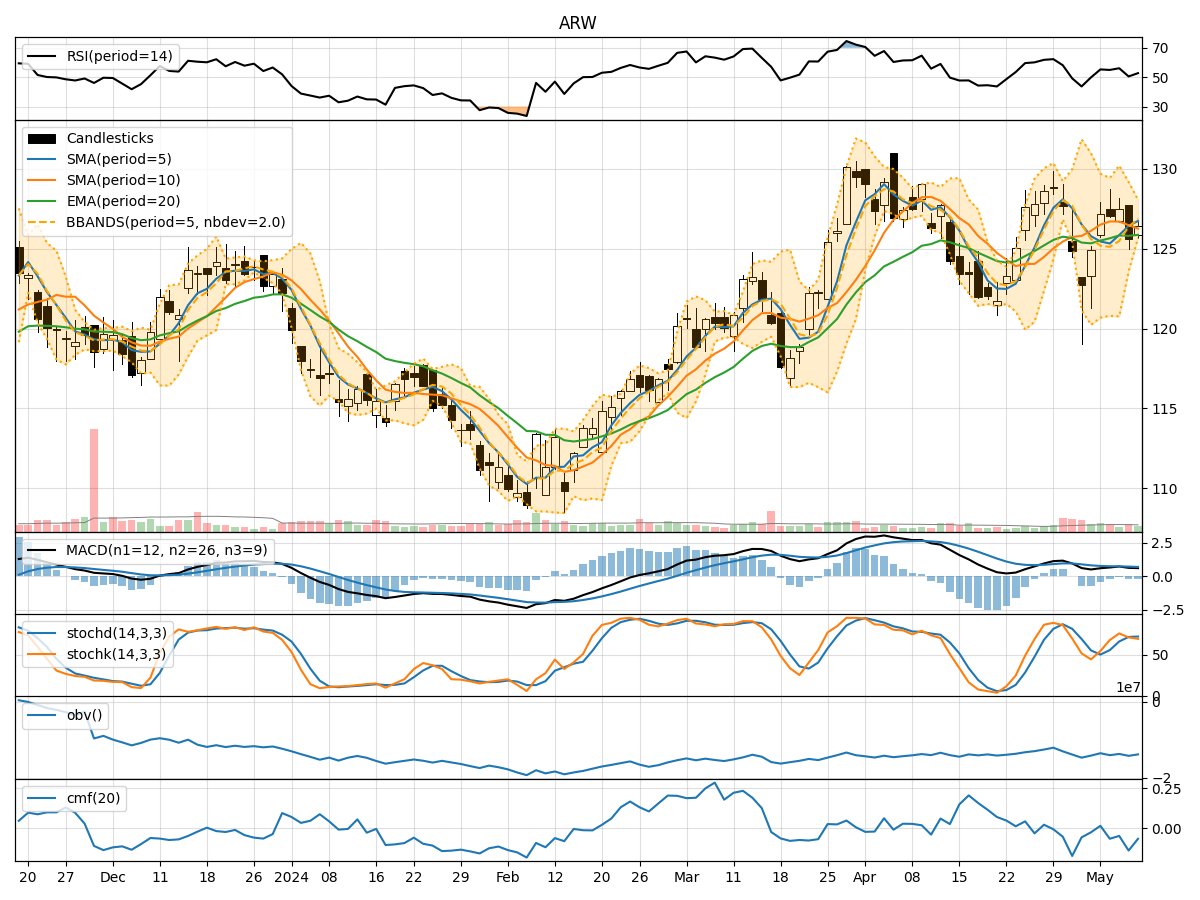
In analyzing the technical indicators for ARW over the last 5 days, we will delve into the trend, momentum, volatility, and volume indicators to provide a comprehensive outlook on the possible stock price movement in the coming days.
Trend Analysis:
- Moving Averages (MA): The 5-day Moving Average (MA) has been consistently above the Simple Moving Average (SMA) and Exponential Moving Average (EMA), indicating a short-term bullish trend.
- MACD: The MACD line has been positive, suggesting upward momentum in the stock price.
- MACD Histogram: The MACD Histogram has been decreasing but remains above the zero line, indicating a potential slowdown in the bullish momentum.
Momentum Analysis:
- RSI: The Relative Strength Index (RSI) has been fluctuating around the neutral level of 50, indicating a lack of strong momentum in either direction.
- Stochastic Oscillator: Both %K and %D have been in the overbought territory, suggesting a potential reversal or consolidation phase.
- Williams %R: The Williams %R is in the oversold region, indicating a possible buying opportunity.
Volatility Analysis:
- Bollinger Bands: The stock price has been trading within the Bollinger Bands, with the bands narrowing, indicating decreasing volatility.
- Bollinger %B: The %B indicator is hovering around the middle range, suggesting a balanced market sentiment.
Volume Analysis:
- On-Balance Volume (OBV): The OBV has been fluctuating, indicating indecision among market participants.
- Chaikin Money Flow (CMF): The CMF has been negative, suggesting selling pressure in the stock.
Conclusion:
Based on the analysis of the technical indicators: - Trend: The stock is in an upward trend supported by the moving averages and MACD. - Momentum: The momentum indicators suggest a neutral stance with potential for a reversal. - Volatility: Volatility is decreasing, indicating a possible period of consolidation. - Volume: The volume indicators point towards selling pressure in the stock.
Overall View:
Considering the technical indicators and observations, the stock of ARW is likely to experience sideways movement or consolidation in the coming days. Traders should exercise caution and wait for clearer signals before taking any significant positions.