Technical Analysis of ASAI 2024-05-10
Overview:
In analyzing the technical indicators for ASAI stock over the last 5 days, we will delve into the trends, momentum, volatility, and volume aspects to provide a comprehensive outlook on the possible stock price movement in the coming days.
Trend Analysis:
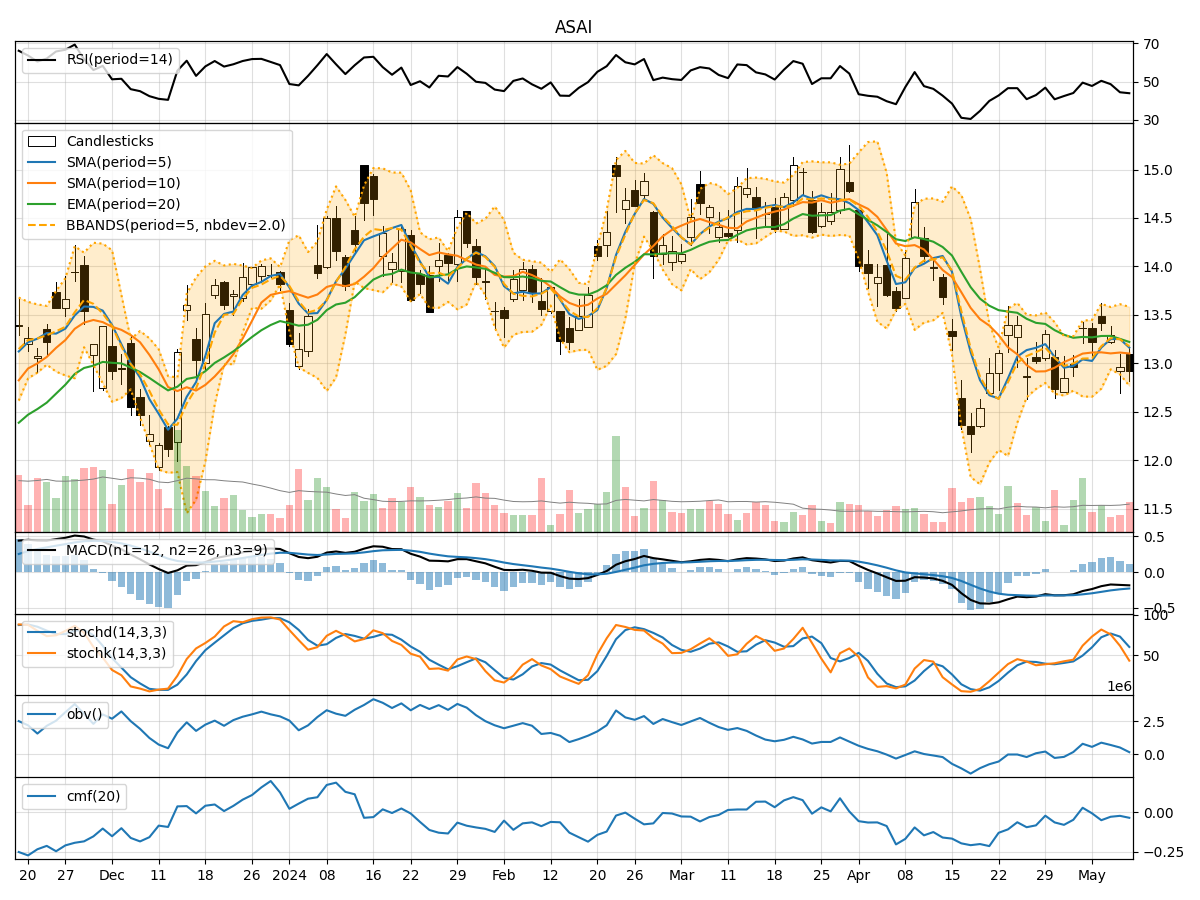
- Moving Averages (MA): The 5-day Moving Average (MA) has been fluctuating around the closing prices, indicating short-term price trends. The Simple Moving Average (SMA) and Exponential Moving Average (EMA) show a slight downward trend, with the EMA slightly below the SMA.
- Moving Average Convergence Divergence (MACD): The MACD line has been consistently negative, indicating a bearish trend. The MACD Histogram (MACDH) has been positive, but decreasing, suggesting a potential reversal.
Momentum Analysis:
- Relative Strength Index (RSI): The RSI has been hovering around the 50 level, indicating a neutral momentum in the stock. There is no clear overbought or oversold signal.
- Stochastic Oscillator: Both %K and %D lines of the Stochastic Oscillator have been declining, signaling a bearish momentum. The stock is currently oversold based on the %K line.
Volatility Analysis:
- Bollinger Bands (BB): The Bollinger Bands have been narrowing, indicating decreasing volatility. The stock price has been trading within the bands, suggesting a period of consolidation.
- Bollinger %B (BBP): The %B indicator is below 1, indicating that the stock price is trading below the lower Bollinger Band, which could signal a potential oversold condition.
Volume Analysis:
- On-Balance Volume (OBV): The OBV has been consistently negative, indicating selling pressure in the stock. The declining OBV suggests that more volume is associated with down days.
- Chaikin Money Flow (CMF): The CMF has been negative, indicating that money is flowing out of the stock. The negative CMF aligns with the bearish sentiment in the stock.
Conclusion:
Based on the analysis of the technical indicators, the stock is currently in a bearish phase with downward trends in moving averages, negative MACD, and declining momentum indicators. The volatility is decreasing, suggesting a period of consolidation, while the volume indicators point towards continued selling pressure.
Outlook:
Given the current technical signals, the next few days are likely to see the stock price continue its downward trajectory. Traders and investors should exercise caution and consider waiting for more positive technical signals before considering any long positions. The stock is currently not showing signs of a reversal, and further downside movement is anticipated in the short term.