Technical Analysis of ASC 2024-05-10
Overview:
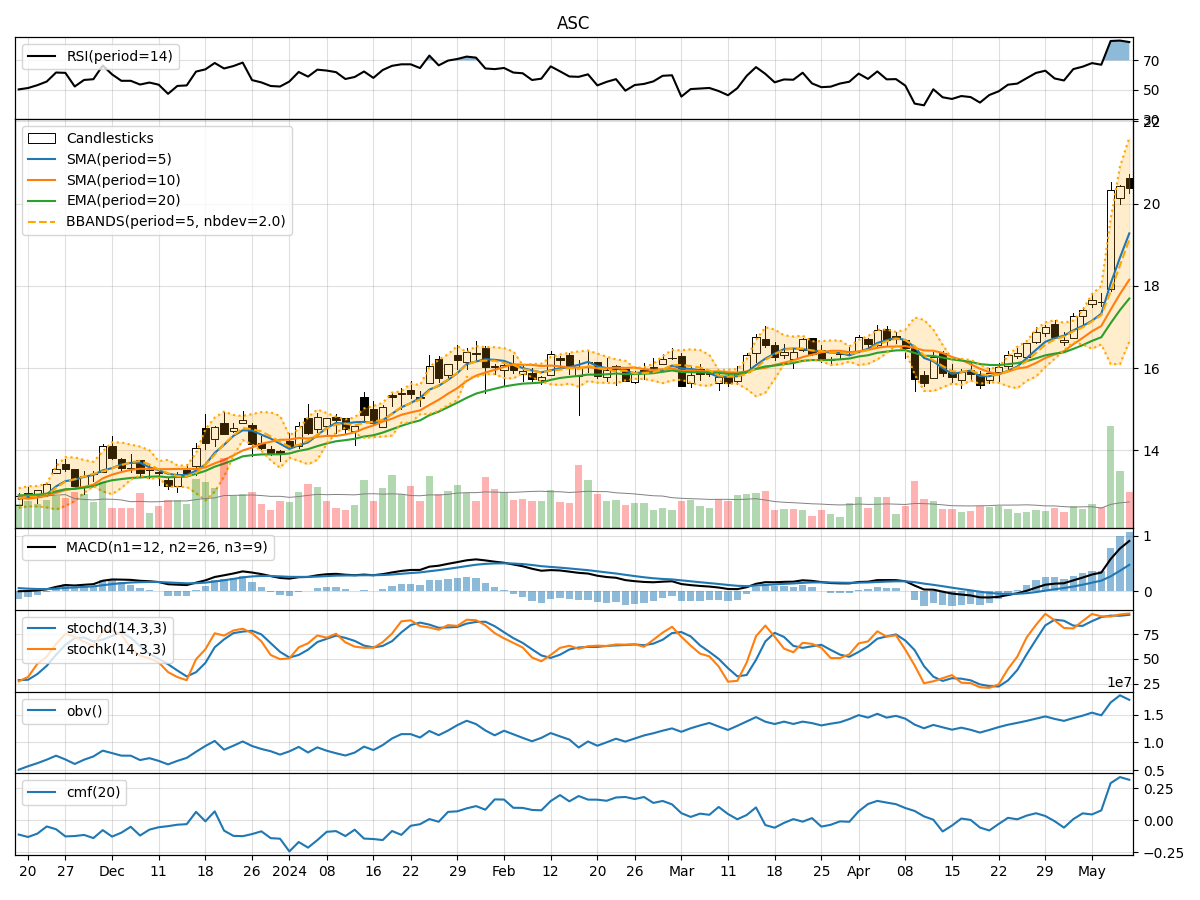
In the last 5 trading days, ASC stock has shown a consistent upward trend in both price and volume. The moving averages have been steadily increasing, indicating a bullish momentum. Momentum indicators such as RSI and Stochastic oscillators are in overbought territory, suggesting a potential pullback. Volatility indicators like Bollinger Bands have widened, reflecting increased price fluctuations. Volume indicators show a positive trend in On-Balance Volume (OBV) and Chaikin Money Flow (CMF), indicating strong buying pressure.
Trend Analysis:
- Moving Averages (MA): The 5-day Moving Average has been consistently above the longer-term SMAs and EMAs, indicating a strong uptrend.
- MACD: The MACD line has been above the signal line, showing bullish momentum.
Key Observation: The trend indicators suggest a strong bullish sentiment in the stock.
Momentum Analysis:
- RSI: The RSI is in the overbought zone, indicating a potential reversal or correction.
- Stochastic Oscillators: Both %K and %D are in the overbought region, signaling a possible downturn.
Key Observation: Momentum indicators suggest a potential short-term pullback or consolidation.
Volatility Analysis:
- Bollinger Bands (BB): The widening of the Bollinger Bands indicates increased volatility and potential price swings.
Key Observation: Volatility indicators suggest a higher probability of price fluctuations in the near term.
Volume Analysis:
- On-Balance Volume (OBV): The OBV has been steadily increasing, reflecting strong accumulation by investors.
- Chaikin Money Flow (CMF): The CMF is positive, indicating buying pressure in the stock.
Key Observation: Volume indicators support the bullish trend with increasing buying interest.
Conclusion:
Based on the technical analysis of ASC stock: - Trend: The stock is in a strong upward trend supported by moving averages and MACD. - Momentum: The overbought readings on RSI and Stochastic suggest a potential pullback or consolidation. - Volatility: The widening Bollinger Bands indicate increased volatility and potential price swings. - Volume: Strong buying pressure is evident from OBV and CMF.
Forecast:
Considering the overall analysis, the next few days for ASC stock are likely to see a short-term pullback or consolidation due to overbought momentum indicators. However, the overall trend remains bullish, and any dips could present buying opportunities for investors looking to capitalize on the stock's upward trajectory. Traders should exercise caution and wait for a potential dip to enter long positions, while investors can hold onto their positions with a long-term bullish view.