Technical Analysis of ASH 2024-05-10
Overview:
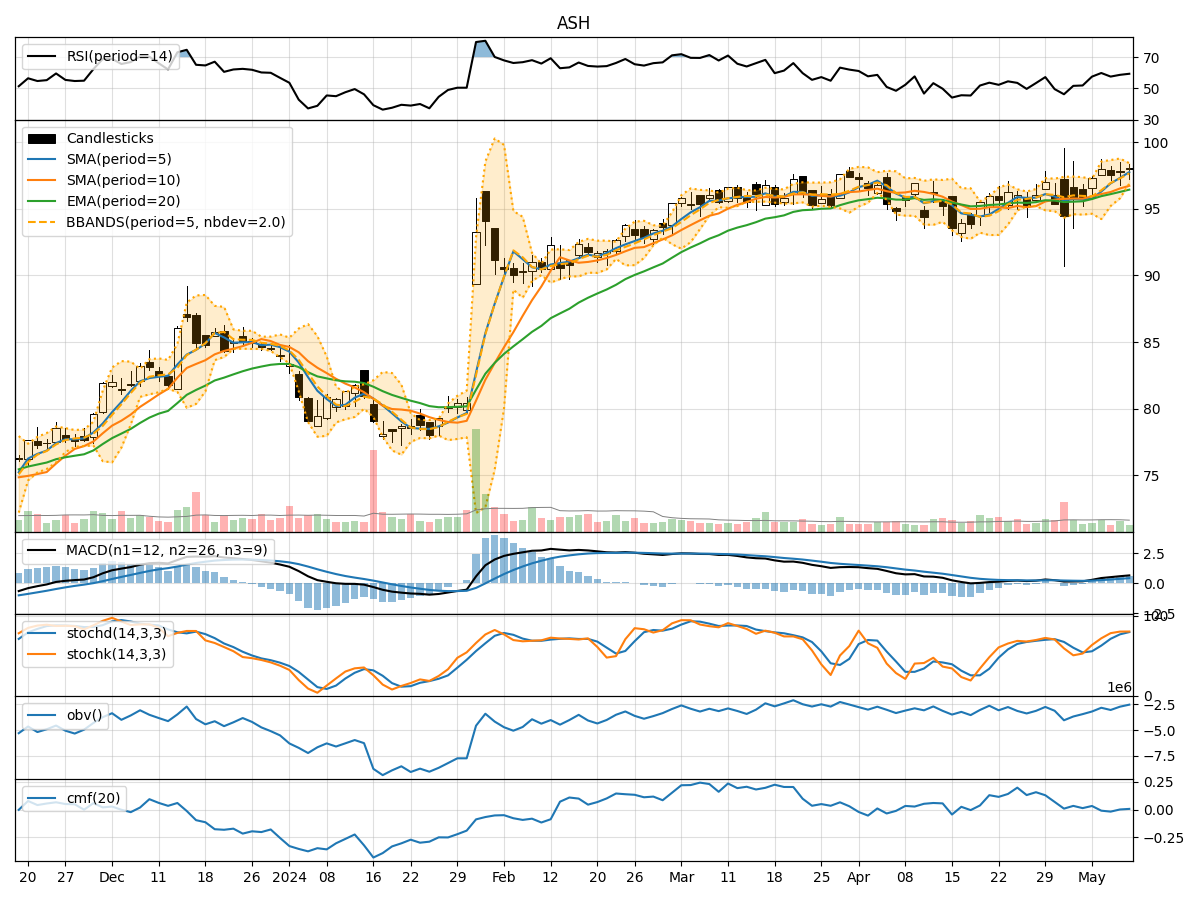
In analyzing the technical indicators for ASH stock over the last 5 days, we will delve into the trends, momentum, volatility, and volume indicators to provide a comprehensive outlook on the possible future stock price movement. By examining key metrics such as moving averages, MACD, RSI, Bollinger Bands, and OBV, we aim to offer valuable insights and predictions for the upcoming trading days.
Trend Indicators:
- Moving Averages (MA): The 5-day MA has been consistently above the closing prices, indicating a bullish trend.
- MACD: The MACD line has been trending upwards, with the MACD histogram showing an increasing positive momentum.
- EMA: The EMA has been steadily rising, supporting the bullish sentiment in the short to medium term.
Momentum Indicators:
- RSI: The RSI has been hovering around the mid-level, suggesting a neutral momentum.
- Stochastic Oscillator: Both %K and %D have been in overbought territory, indicating a potential reversal or consolidation.
- Williams %R: The indicator has been fluctuating near the oversold region, signaling a possible reversal.
Volatility Indicators:
- Bollinger Bands: The stock price has been trading within the bands, indicating a period of consolidation.
- Bollinger %B: The %B value has been fluctuating around 0.5, suggesting a balanced market sentiment.
- Bollinger Band Width: The narrowing of the bands indicates decreasing volatility and a potential breakout in the near future.
Volume Indicators:
- On-Balance Volume (OBV): The OBV has shown a slight increase, reflecting a positive accumulation of volume.
- Chaikin Money Flow (CMF): The CMF has been slightly negative, indicating some selling pressure in the market.
Key Observations:
- The stock is currently in a bullish trend based on moving averages and MACD.
- Momentum indicators suggest a neutral to slightly overbought condition, hinting at a possible consolidation phase.
- Volatility indicators point towards a period of low volatility and potential price breakout.
- Volume indicators show a slight increase in buying pressure but with some selling pressure as well.
Conclusion:
Based on the analysis of the technical indicators, the stock is likely to experience a period of consolidation in the upcoming days. The bullish trend indicated by moving averages and MACD may face resistance due to the neutral momentum and overbought stochastic levels. The narrowing Bollinger Bands suggest a breakout is imminent, but the overall market sentiment remains balanced. Traders should exercise caution and wait for a clearer signal before making significant trading decisions.