Technical Analysis of ASR 2024-05-10
Overview:
In analyzing the technical indicators for ASR stock over the last 5 days, we will delve into the trend, momentum, volatility, and volume indicators to provide a comprehensive outlook on the possible stock price movement in the coming days.
Trend Indicators:
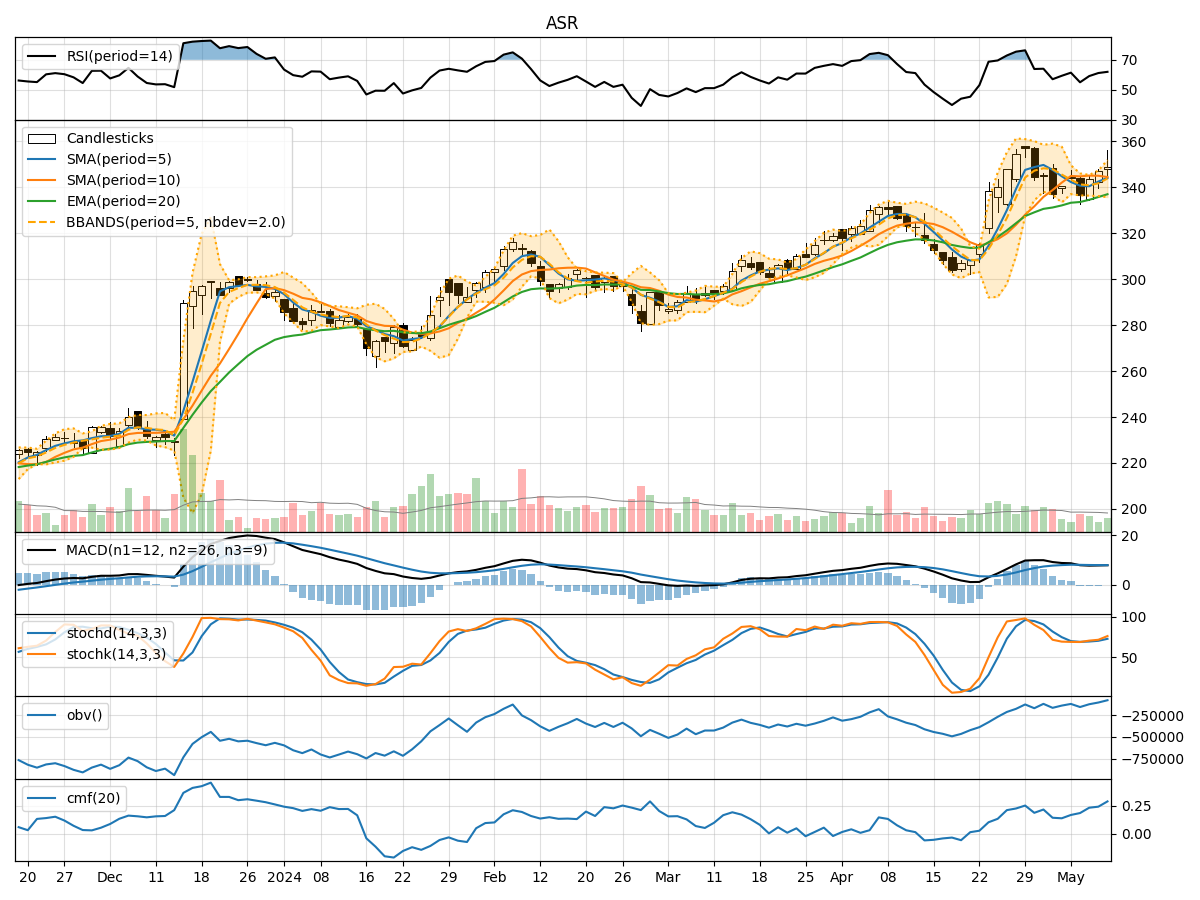
- Moving Averages (MA): The 5-day Moving Average (MA) has been fluctuating around the closing prices, indicating short-term price trends. The Simple Moving Average (SMA) and Exponential Moving Average (EMA) show a slight convergence, suggesting potential stability in the stock price.
- Moving Average Convergence Divergence (MACD): The MACD line has been hovering around the signal line, indicating a possible trend reversal or consolidation in the stock price.
- Conclusion: The trend indicators suggest a sideways movement or potential consolidation in the stock price.
Momentum Indicators:
- Relative Strength Index (RSI): The RSI values have been fluctuating around the neutral zone, indicating a balanced momentum between buying and selling pressure.
- Stochastic Oscillator: The Stochastic Oscillator shows the stock is not in overbought or oversold territory, suggesting a balanced momentum.
- Williams %R (WillR): The Williams %R indicates the stock is not in extreme overbought or oversold conditions.
- Conclusion: The momentum indicators suggest a neutral momentum with no clear bias towards bullish or bearish sentiment.
Volatility Indicators:
- Bollinger Bands (BB): The Bollinger Bands have been relatively narrow, indicating low volatility in the stock price.
- Conclusion: The volatility indicators suggest low volatility in the stock price, potentially leading to a stable price movement.
Volume Indicators:
- On-Balance Volume (OBV): The OBV has shown a slight increase, indicating a potential accumulation of the stock.
- Chaikin Money Flow (CMF): The CMF has been positive, suggesting buying pressure in the stock.
- Conclusion: The volume indicators suggest positive volume flow and potential accumulation of the stock.
Overall Conclusion:
Based on the analysis of the technical indicators, the next few days for ASR stock are likely to see a sideways movement with low volatility. The trend indicators point towards consolidation, while the momentum indicators indicate a neutral stance. The volume indicators suggest positive volume flow and potential accumulation of the stock. Therefore, it is recommended to monitor the stock closely for any signs of a breakout or trend reversal before making any trading decisions.