Technical Analysis of ATHM 2024-05-10
Overview:
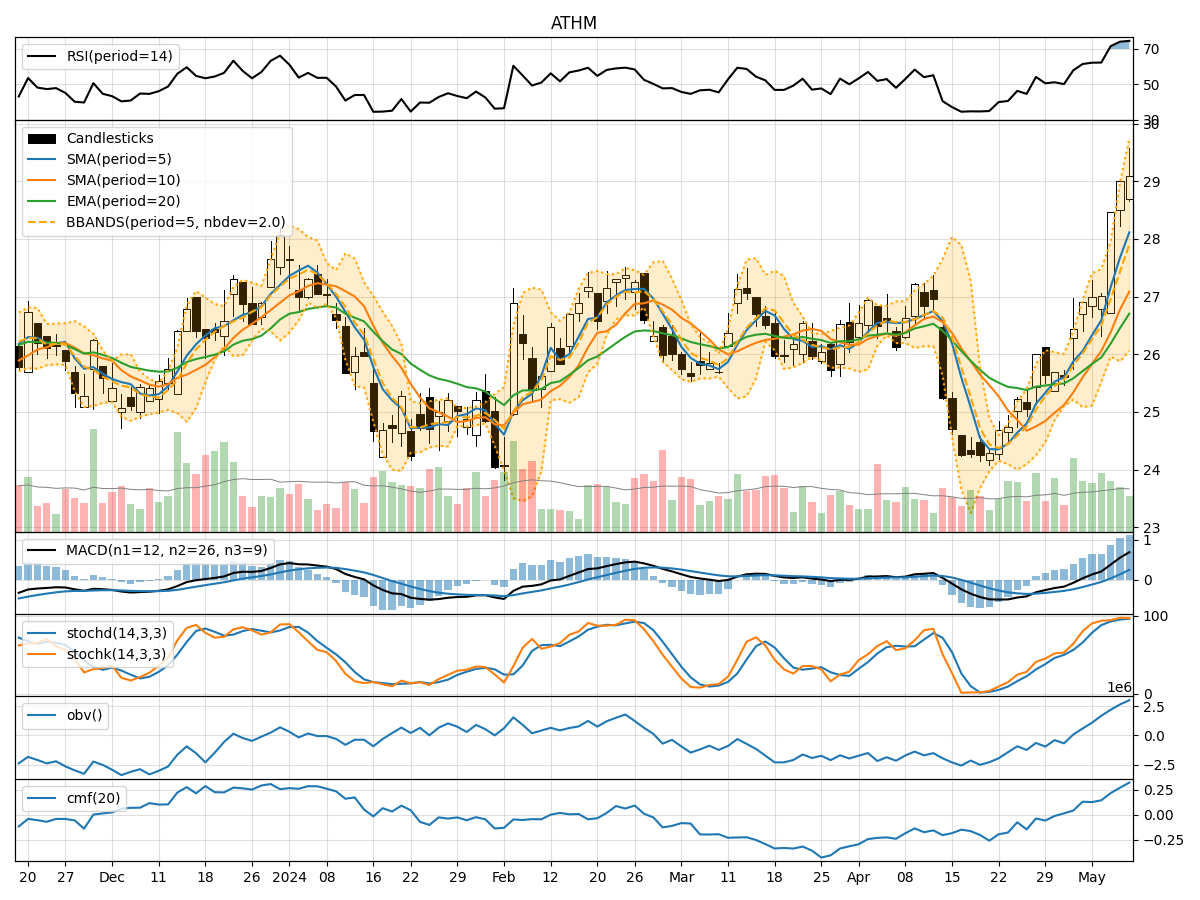
In the last 5 trading days, ATHM has shown a consistent upward trend in its stock price, accompanied by increasing volume and positive momentum indicators. The volatility indicators also suggest a widening of the Bollinger Bands, indicating potential price expansion. The overall technical analysis points towards a bullish sentiment in the stock.
Trend Analysis:
- Moving Averages (MA): The 5-day Moving Average (MA) has been consistently above the Simple Moving Average (SMA) and Exponential Moving Average (EMA), indicating a bullish trend.
- MACD: The MACD line has been consistently above the signal line, with both lines showing an upward trajectory, indicating bullish momentum.
- RSI: The Relative Strength Index (RSI) has been in the overbought territory, suggesting a strong bullish momentum.
Momentum Analysis:
- Stochastic Oscillator: Both %K and %D lines of the Stochastic Oscillator are in the overbought zone, indicating a strong bullish momentum.
- Williams %R: The Williams %R is also in the oversold territory, further supporting the bullish sentiment.
Volatility Analysis:
- Bollinger Bands (BB): The Bollinger Bands have been widening, indicating increased volatility and potential price expansion.
- Bollinger %B: The %B indicator is below 1, suggesting that the stock price is trading below the upper Bollinger Band, which could indicate a potential upward movement.
Volume Analysis:
- On-Balance Volume (OBV): The OBV has been steadily increasing, indicating strong buying pressure and accumulation of the stock.
- Chaikin Money Flow (CMF): The CMF is positive, indicating that money is flowing into the stock, supporting the bullish trend.
Conclusion:
Based on the comprehensive analysis of the technical indicators, the next few days are likely to see a continuation of the bullish trend in ATHM. The stock has strong momentum, supported by increasing volume and positive trend indicators. The widening Bollinger Bands suggest potential price expansion, and the overbought conditions in the RSI and Stochastic Oscillator indicate a strong bullish sentiment.
Key Conclusion: The stock is poised for further upward movement in the coming days. Traders and investors may consider taking long positions or holding onto existing positions to benefit from the expected bullish trend.