Technical Analysis of ATS 2024-05-10
Overview:
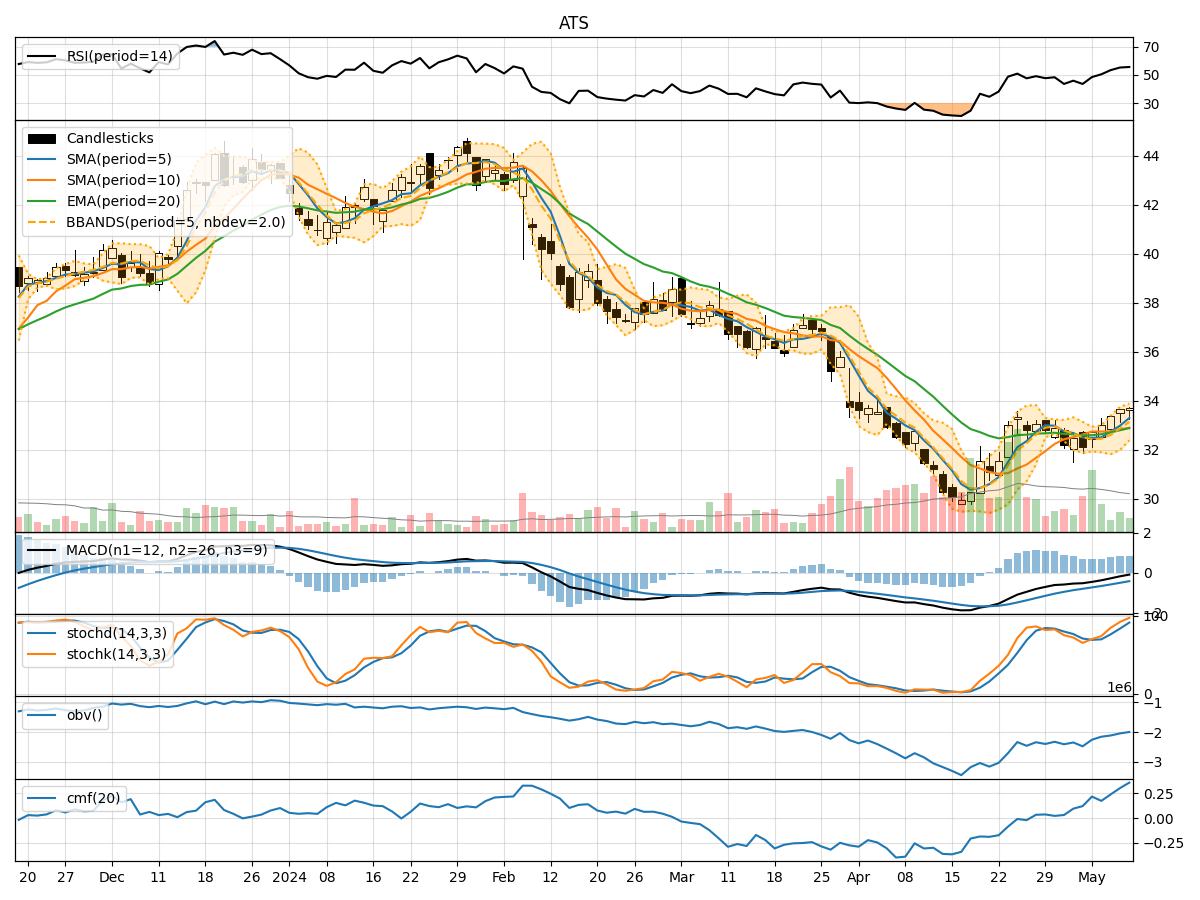
In the last 5 trading days, the stock price of ATS has shown a gradual increase, accompanied by fluctuating trading volumes. The trend indicators suggest a positive momentum with moving averages trending upwards. Momentum indicators indicate a strengthening buying pressure, while volatility indicators show an expanding range. Volume indicators also reflect a positive accumulation/distribution trend.
Trend Indicators Analysis:
- Moving Averages (MA): The 5-day MA has been consistently above the 10-day SMA, indicating a short-term bullish trend. The EMA(20) is also trending upwards, supporting the bullish sentiment.
- MACD: The MACD line has been consistently above the signal line, with both lines showing an upward trend. The MACD histogram is also in positive territory, indicating a bullish momentum.
Momentum Indicators Analysis:
- RSI: The RSI has been gradually increasing and is currently in the mid-range, suggesting room for further upside potential without being overbought.
- Stochastic Oscillator: Both %K and %D lines of the Stochastic Oscillator are in the overbought zone, indicating a strong buying momentum.
- Williams %R: The Williams %R is close to the oversold territory, suggesting a potential reversal in the short term.
Volatility Indicators Analysis:
- Bollinger Bands (BB): The Bollinger Bands have been widening, indicating increased volatility. The price has been consistently trading above the middle band, suggesting an upward trend.
- Bollinger %B: The %B indicator is above 0.5, indicating that the price is closer to the upper band, signaling a bullish sentiment.
Volume Indicators Analysis:
- On-Balance Volume (OBV): The OBV has been steadily increasing, indicating a positive accumulation trend.
- Chaikin Money Flow (CMF): The CMF is positive and has been trending upwards, suggesting strong buying pressure.
Conclusion:
Based on the comprehensive analysis of the technical indicators, the next few days' possible stock price movement for ATS is bullish. The trend indicators, momentum indicators, volatility indicators, and volume indicators all point towards a continuation of the current uptrend. The stock is likely to experience further price appreciation in the coming days. Traders and investors may consider taking long positions or holding onto existing positions to benefit from the anticipated upward movement in the stock price.